


 GHS2022 Hunger Chart.
(Source: Supplied)
GHS2022 Hunger Chart.
(Source: Supplied) Claims: Seven claims about hunger, unemployment and poverty in South Africa
Source: South African political party Rise Mzansi (January 2024)
Verdict: Checked
Explainer: Four correct, one mostly correct, one understated, one unproven
- Rise Mzansi was correct in its assertions about unemployment in South Africa, including that it affects black women the most, the majority of whom live below the poverty line.
- While there is evidence that millions of South Africans don’t meet their daily nutritional needs, as the party said, the claim that food insecurity and hunger have increased since 1994 is unproven.
- The party’s manifesto under-reports the number of South Africans living with disabilities, and a statement about inequality in the country needs to be clarified in an important way.
The new kid on the political block, Rise Mzansi, launched its election manifesto on 20 January.
The People’s Manifesto was compiled after “almost a year of listening and discussion with hundreds of communities across” South Africa, Rise Mzansi said.
The political party was formed in April 2023 and is contesting its first national election this year.
The word “Mzansi”, derived from isiXhosa, is a widely used informal name for South Africa.
The manifesto sets out the party’s priorities in five key areas: leadership, safety, the economy, community and climate.
When a reader asked us to fact-check one of the claims made in the document, we took the opportunity to look into a number of others. Here’s what we found.
Claim: “Half of unemployed South Africans do not have matric.”
Verdict: Correct
 ‘Half of unemployed South Africans do not have matric’. (Photo: Tom Barrett / Unsplash)
Rise Mzansi identifies providing skills training opportunities for people who have not completed school as an “urgent priority”. According to the party, half of all unemployed South Africans did not matriculate.
We asked Rise Mzansi for the source of this and other claims made in its manifesto. It referred Africa Check to a page on Statista, an online subscription-based statistics provider. This showed the proportion of unemployed people in South Africa in the second quarter of 2023, by level of education.
In this quarter (from April to June), 7.9 million people were unemployed. Of these, 50.1% had not completed high school. Just over 40% had matriculated, while 2.4% were university graduates.
The source of the data is Statistics South Africa (Stats SA), which tracks employment figures through its quarterly labour force survey.
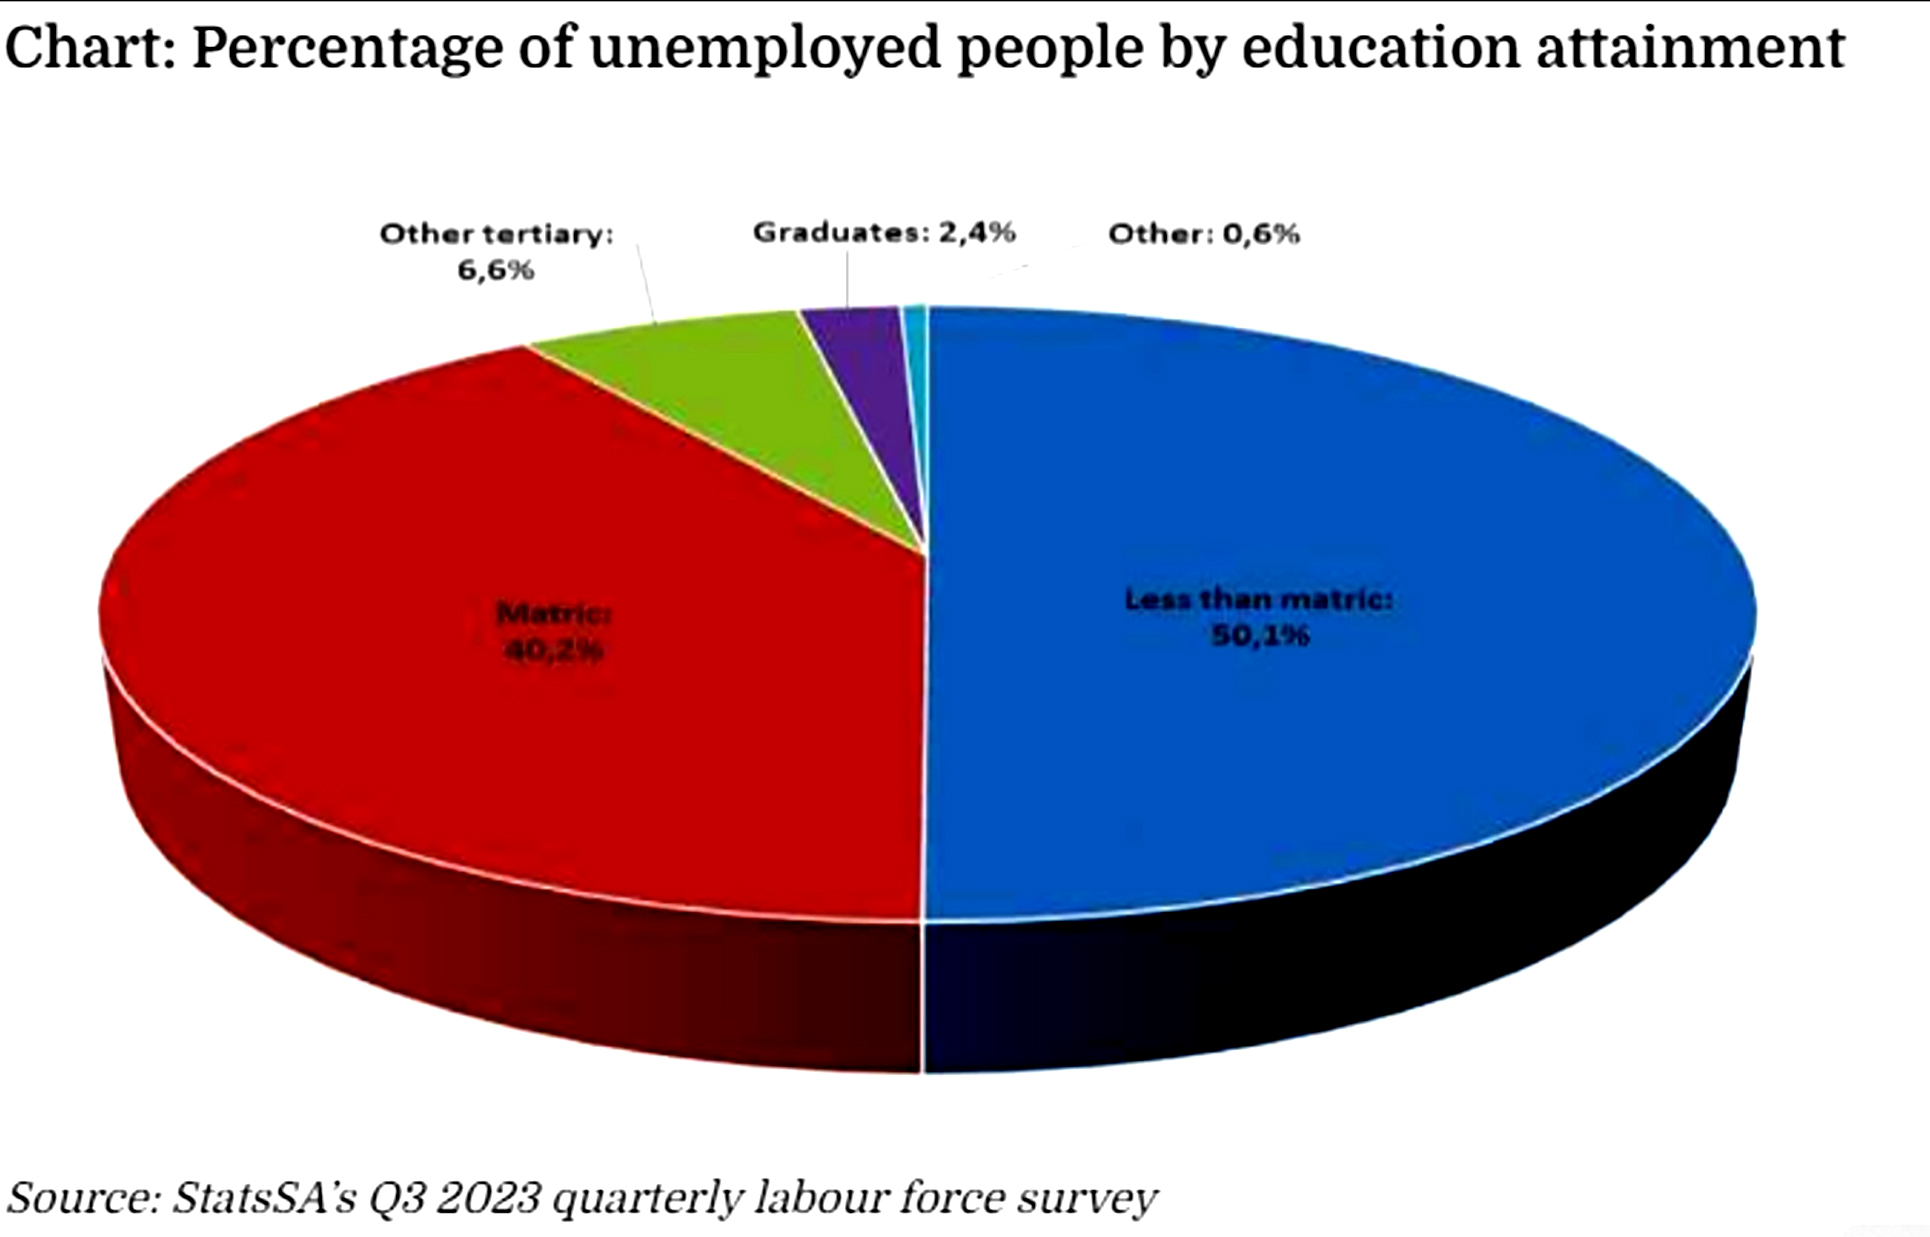
According to Stats SA, these figures show the importance of education in reducing unemployment rates. The unemployment rates for those with a matric or less were above the national rate, while the unemployment rates for those with other tertiary qualifications and university graduates were below the national rate.
Claim: “More than four million South Africans live with a disability.”
Verdict: Understated
The World Health Organization (WHO) says that disability is an integral part of the human experience. A priority for Rise Mzansi is to ensure that people with disabilities have access to the human rights afforded to all South Africans.
“The data on the number of South Africans living with a disability varies widely,” the party told Africa Check. It directed us to a 2021 presentation by the City of Johannesburg on the demographic profile of people living with disabilities.
According to the presentation, in 2019 3.5 million South Africans aged five years and older (6.6%) were classified as having a disability.
Rise Mzansi also sent Africa Check an infographic from the National Council of and for Persons with Disabilities, which says that 15% of South Africans have a disability. Bernadette Rigney, the organisation’s public relations manager, said the figure was based on statistics from the WHO and the International Labour Organization.
The percentage is consistent with data from Stats SA, which records the number of people living with disabilities in its general household surveys. These ask each member of a household to rate their ability to perform a range of activities, such as seeing, hearing, walking or climbing a flight of stairs, remembering and concentrating, caring for themselves, and communicating in their most commonly used language.
People who struggle with two or more of the activities, those who have a lot of difficulty with one or more of the activities and those who are completely unable to do any one of the activities are classified as disabled.
According to Stats SA, 9.6 million people over five met this definition in 2022. This was 15.7% of SA’s population — and higher (17.4%) if those under five in the general population were excluded. Rise Mzansi understated the figure.
Claim: “South Africa is the most unequal country in the world.”
Verdict: Mostly correct
Inequality is the unequal distribution of resources, opportunities, rights and power among individuals, groups or communities. The nature and extent of inequality can have a significant impact on the overall wellbeing, cohesion and functioning of a society.
In South Africa inequality is most often viewed through an economic lens. Economic inequality refers to significant differences in how much an individual or group earns, owns or consumes.
The Gini index is the most widely used estimate of economic inequality. It provides a score for comparing inequality, called the Gini coefficient. It is a number on a scale from 0, which represents perfect equality, to 1, which represents complete inequality. For income, a value of 0 would mean that everyone has the same income, and a value of 1 would mean that one person receives all the income and everyone else gets nothing.
Data from the World Bank
As its source for this claim, Rise Mzansi referred us to a 2022 World Bank report that looked at inequality in five African countries that make up “the world’s most unequal region”, as measured by the Gini index and other tools.
According to the report, South Africa was “the most unequal country in the world”, ranking first out of 164 countries in the bank’s poverty database. The most recent estimates put South Africa’s Gini coefficient at 0.63 or 0.67, depending on whether consumption or income was used.
Our World in Data, a research and data project in collaboration with the University of Oxford, produces visualisations showing Gini coefficients around the world using the latest available consumption or income data.
While South Africa topped the list, other African countries such as Namibia and Zambia had similarly high coefficients of over 0.5. By comparison, most European countries had values in the range of 0.25 to 0.35, while the US scored 0.42.
The World Bank’s report also looked at wealth inequality. It estimated that the top 10% of the population held 71% of the wealth in South Africa, compared to the top 10% holding 50% of the wealth in a group of high-income countries.
The bottom 60% of the population shared just 7% of South Africa’s wealth, compared with 13% in the high-income countries.
Comparing apples, oranges and unknowns
While the World Bank’s data is widely considered to be of high quality and reliable, there are problems with cross-country comparisons.
The absence of data from various countries in many years from the bank’s database should be considered. Gini data for Gulf countries, such as Saudi Arabia, Iraq, Kuwait and Qatar, is limited, despite other evidence of high inequality in the region. Other countries, such as Afghanistan, Libya and Argentina, also appear to be missing.
Rise Mzansi acknowledged the limitations of the tool, as not every country was included in the calculations. “But this does not [detract] from the generally accepted view that South Africa is the most unequal country,” the party said.
Prof Imraan Valodia directs the Southern Centre for Inequality Studies at the University of the Witwatersrand. He told Africa Check that the claim was factually correct. However, he stressed that the statement should be qualified by saying that South Africa’s Gini is the “highest in the world of countries for which we have data”.
The World Bank has detailed other limitations of the Gini index. For example, it says there are often differences in the surveys used by different countries to collect data. As a result, there may be some bias in comparisons between countries, but the bank says it has “made an effort to ensure that the data are as comparable as possible”.
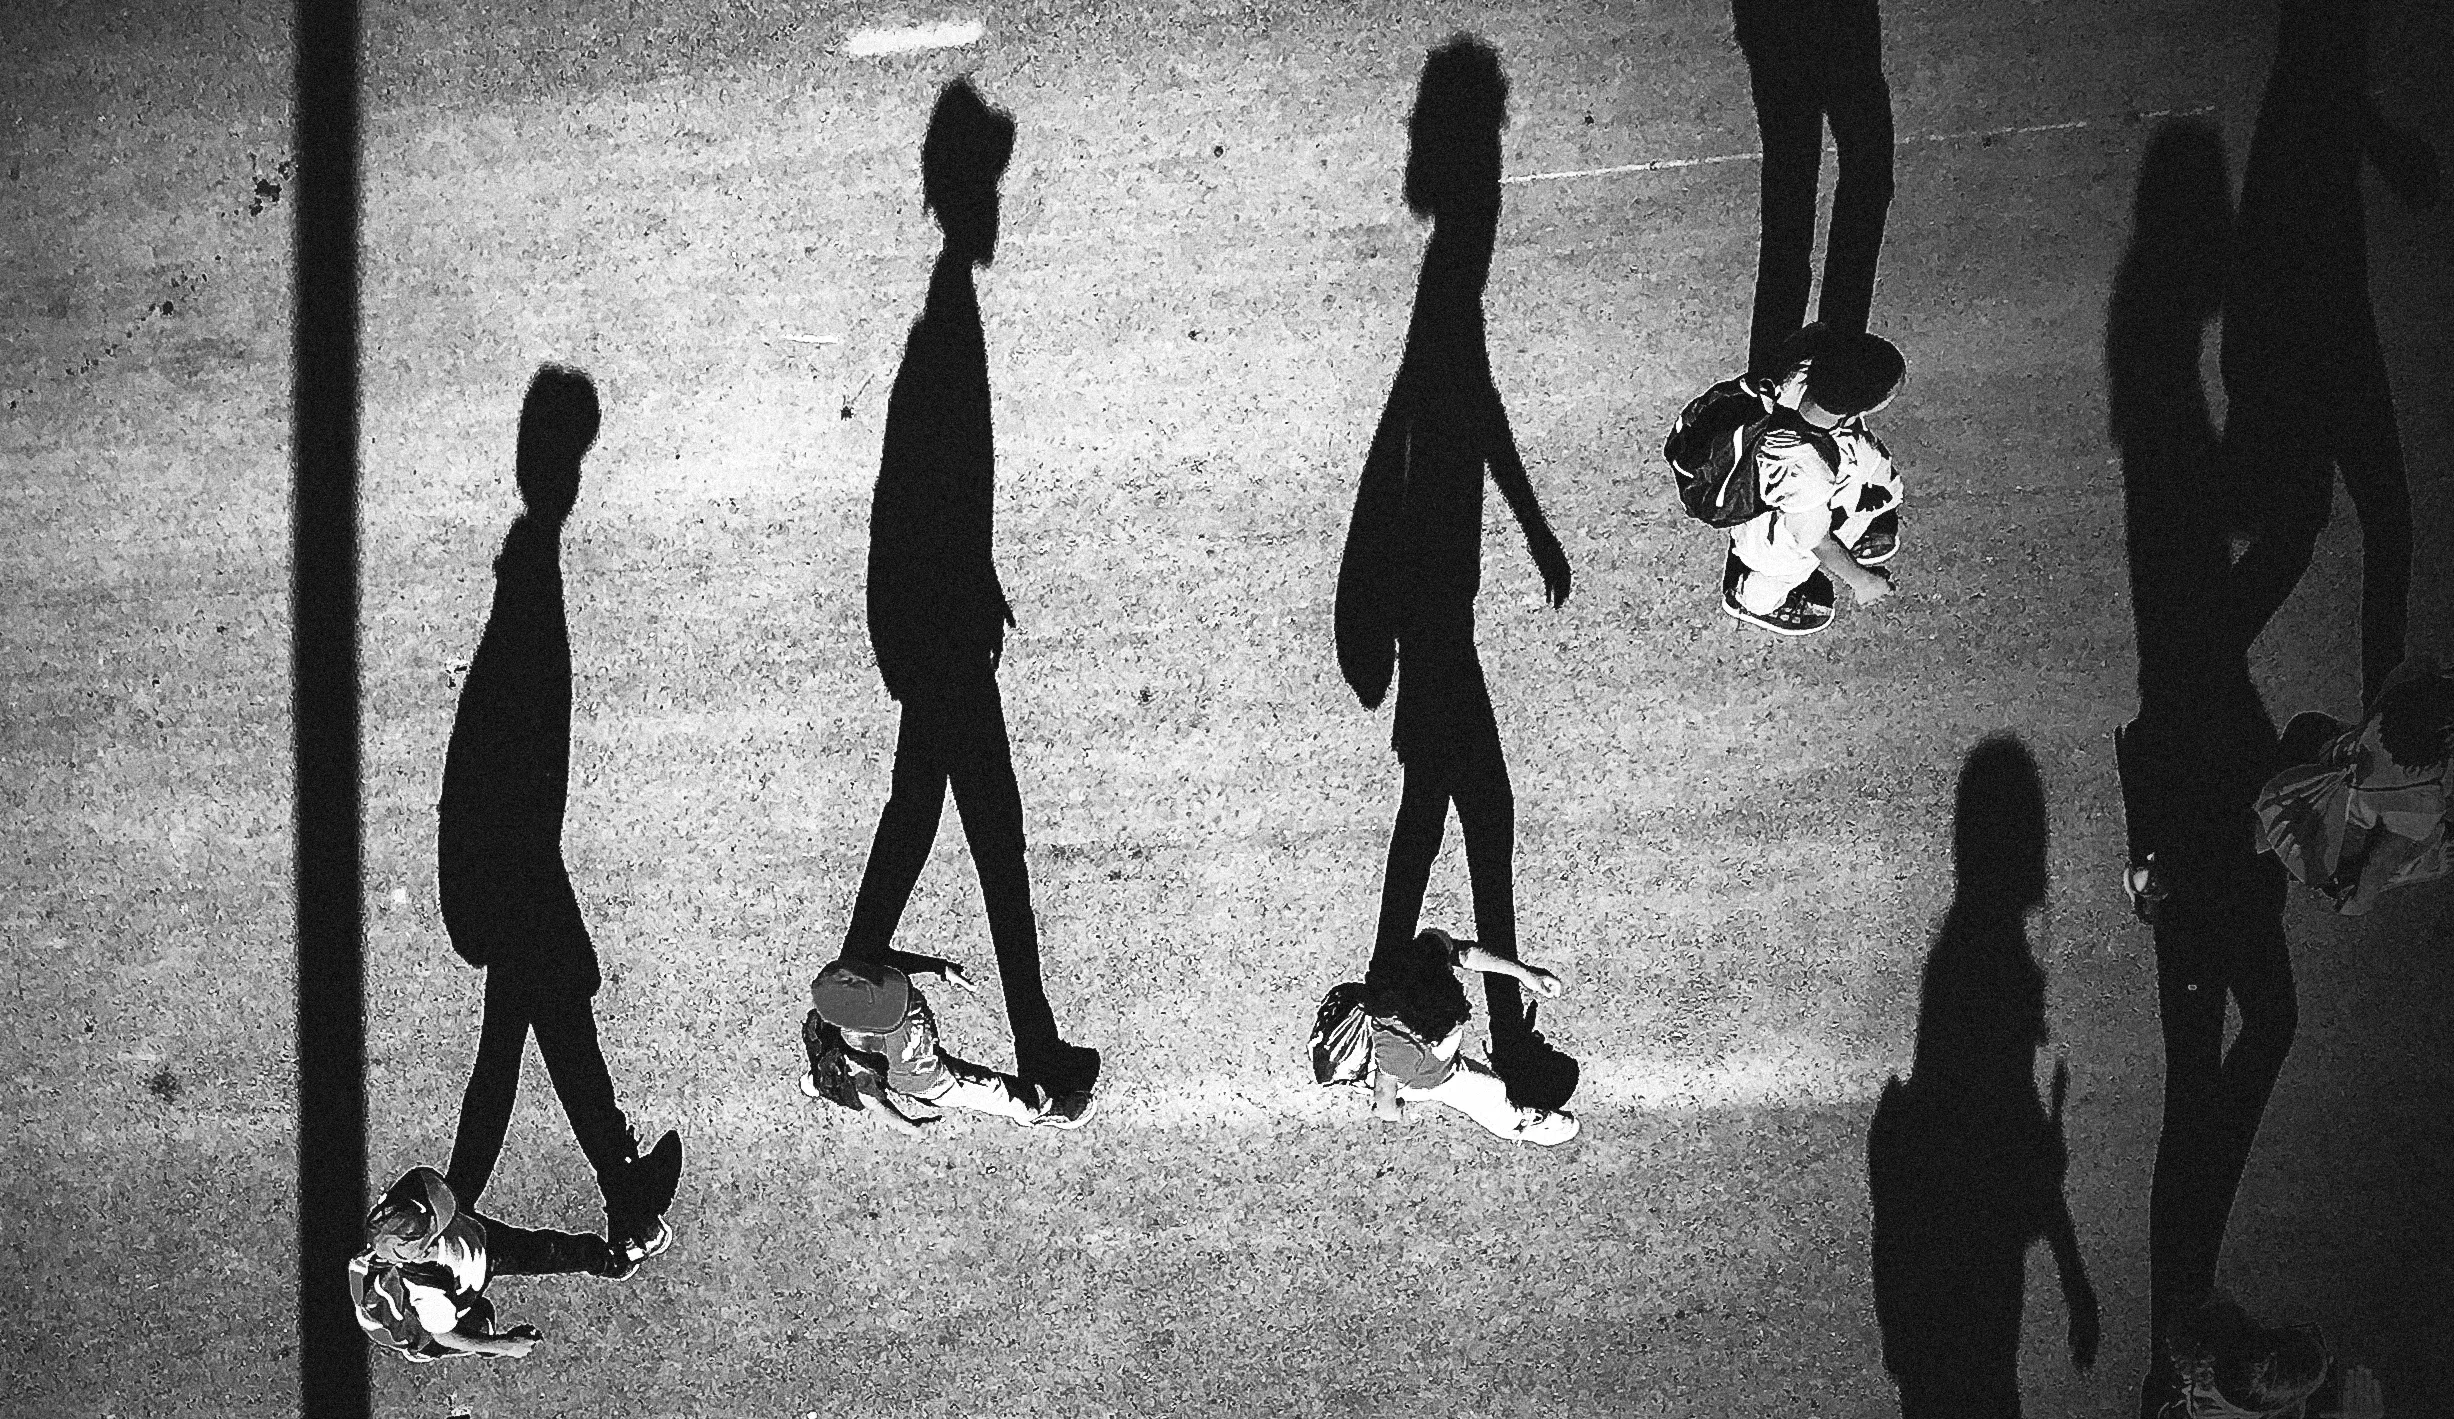
Claim: “Black women are more likely to be unemployed.”
Verdict: Correct
As evidence for this claim, Rise Mzansi referred us to the South Africa National Human Development Report 2022, compiled by the United Nations Development Programme and the South African government.
In it, the authors break down unemployment data from two quarters in 2021 and conclude that unemployment was higher among black African women than other demographic groups, with rates ranging from 41% to 41.5%.
The report draws its data from Stats SA, which publishes the results of national labour force surveys every three months. Africa Check contacted Stats SA for the latest numbers.
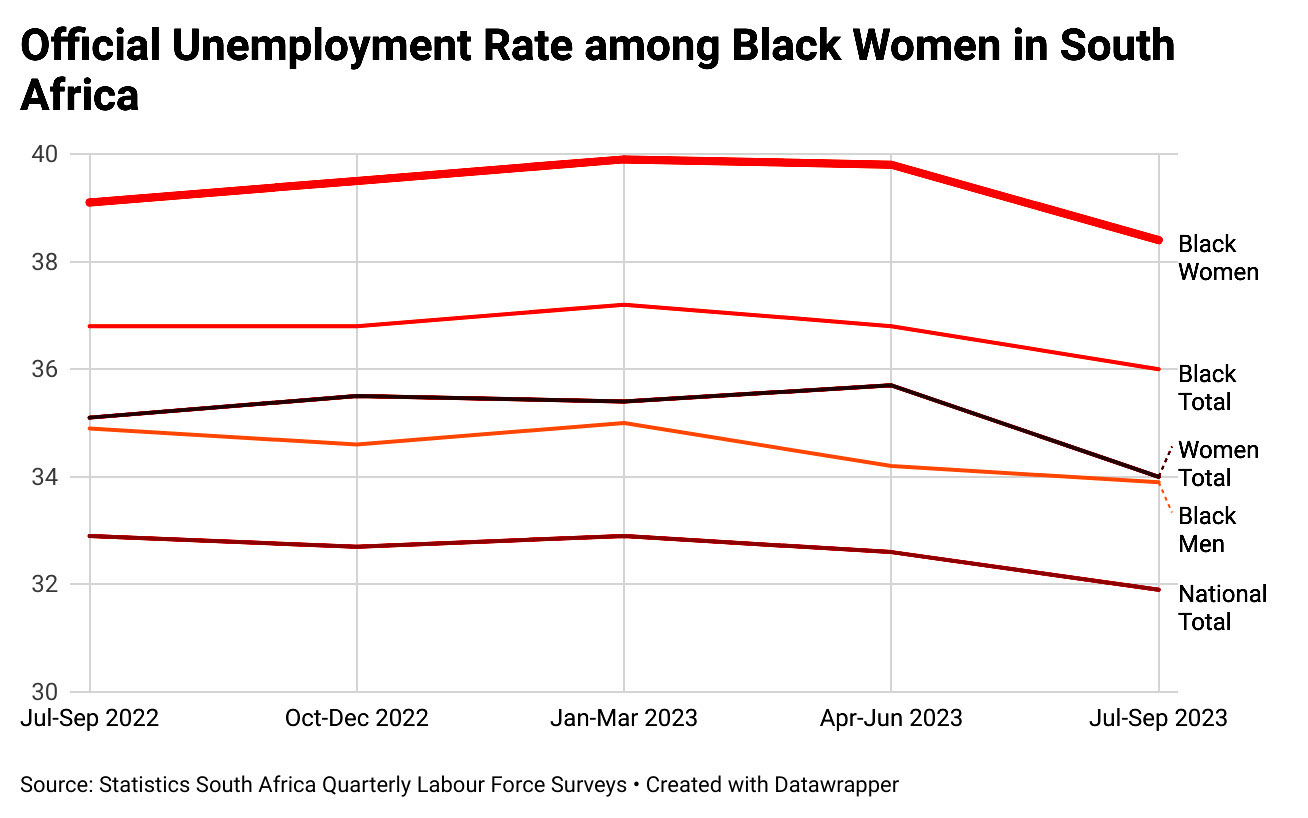
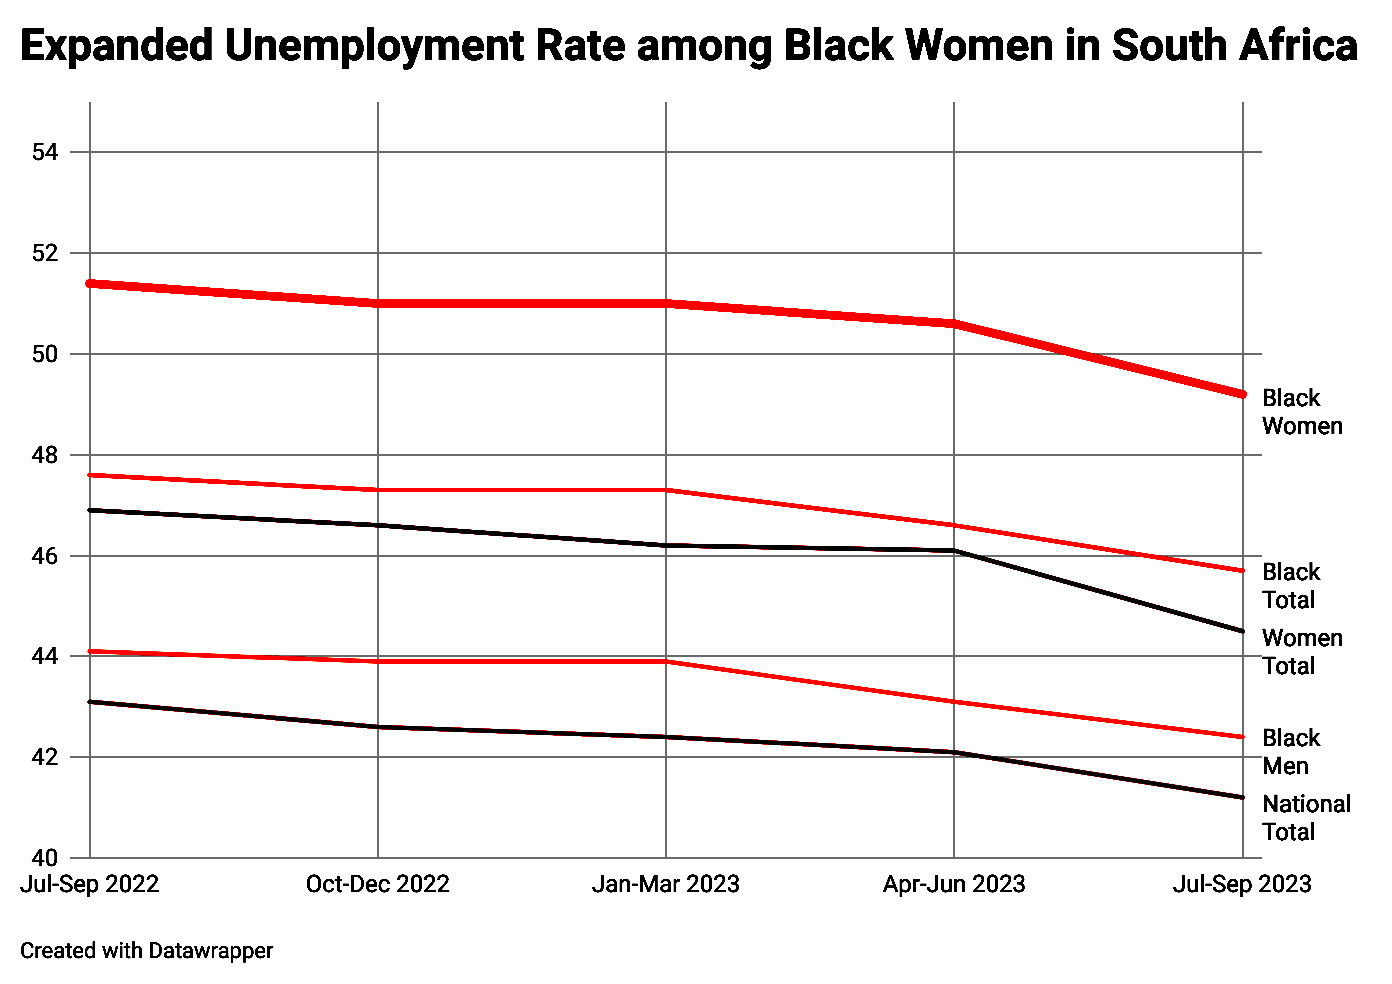
The data show that, according to the official or “strict” definition, unemployment among black women ranged between 38.4% and 39.9% from the third quarter of 2022 to the same period in 2023. This was higher than for black men, women of other races, and the national average.
Figures under the extended definition of unemployment, which includes discouraged jobseekers, show the same trend, with higher rates for black women (ranging from 49.2% to 51.4%) compared to black men, women of other races or the national average. We therefore consider this claim to be correct.
Claim: “[Black women are more likely] to live below the poverty line.”
Verdict: Correct
Poverty in South Africa is usually measured using poverty lines (although there are many other methods). Poverty lines are estimates of the amount of money a person needs each month to afford certain items for their survival.
- The upper-bound poverty line indicates the point at which someone can afford a list of specific essential food and non-food items.
- The lower-bound poverty line is the point at which someone cannot afford to buy both essential food and non-food items, so they sacrifice food to buy other essentials.
- The food poverty line is the amount of money needed to meet only the daily minimum energy requirement.
When asked for the data behind this claim, Rise Mzansi said it relied on Stats SA reports. Specifically, it steered us to the Poverty Trends in South Africa report. Published in 2017, it looked at data from 2006 to 2015. In it, the authors noted that there was “still a significant [difference] in poverty levels between population groups and the sex of individuals”.
According to the report, black women made up the largest proportion of people living below the lower-bound poverty line in 2011 and 2015. The authors noted that black women were “the main victims in the ongoing struggle against poverty”, along with children, people from rural areas, those with no education and those living in the Eastern Cape and Limpopo.
Africa Check contacted Stats SA about this claim. Werner Ruch, director of poverty and inequality statistics, confirmed that black women were more likely to live below the poverty line than other groups.
Ruch provided data on the percentage of people living in poverty broken down by gender and race, based on the 2014/15 Living Conditions Survey. He confirmed that this was the most recent data available.
According to the data, in 2015 31.7% of black women lived below the food poverty line, 49.2% below the lower-bound poverty line, and 66.3% below the upper-bound poverty line.
This means that for every three black women in South Africa, two are estimated to be living in poverty.
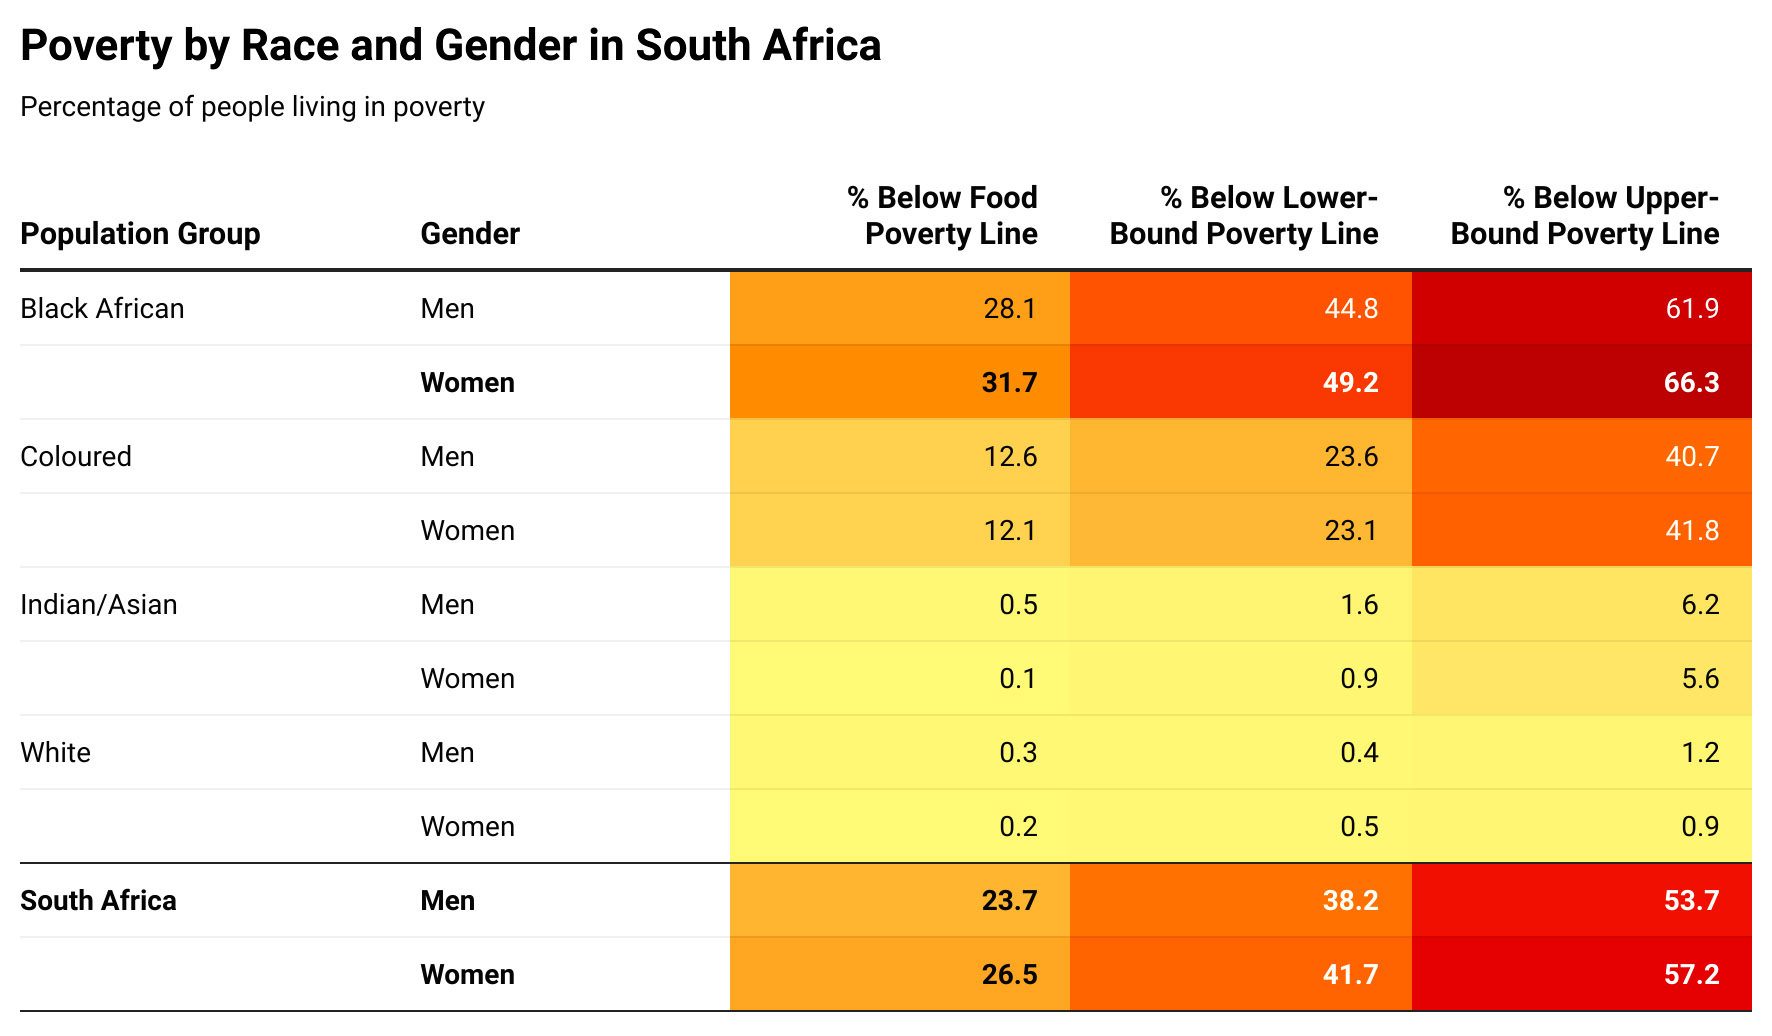 (Source: Statistics South Africa-2014/15 Living Conditions Survey)
Claim: “Millions of South Africans do not have enough food to meet daily needs.”
Verdict: Correct
A report published by Stats SA in 2023 used the results of the 2021 General Household Survey (GHS) to assess “food inadequacy and hunger” in South Africa.
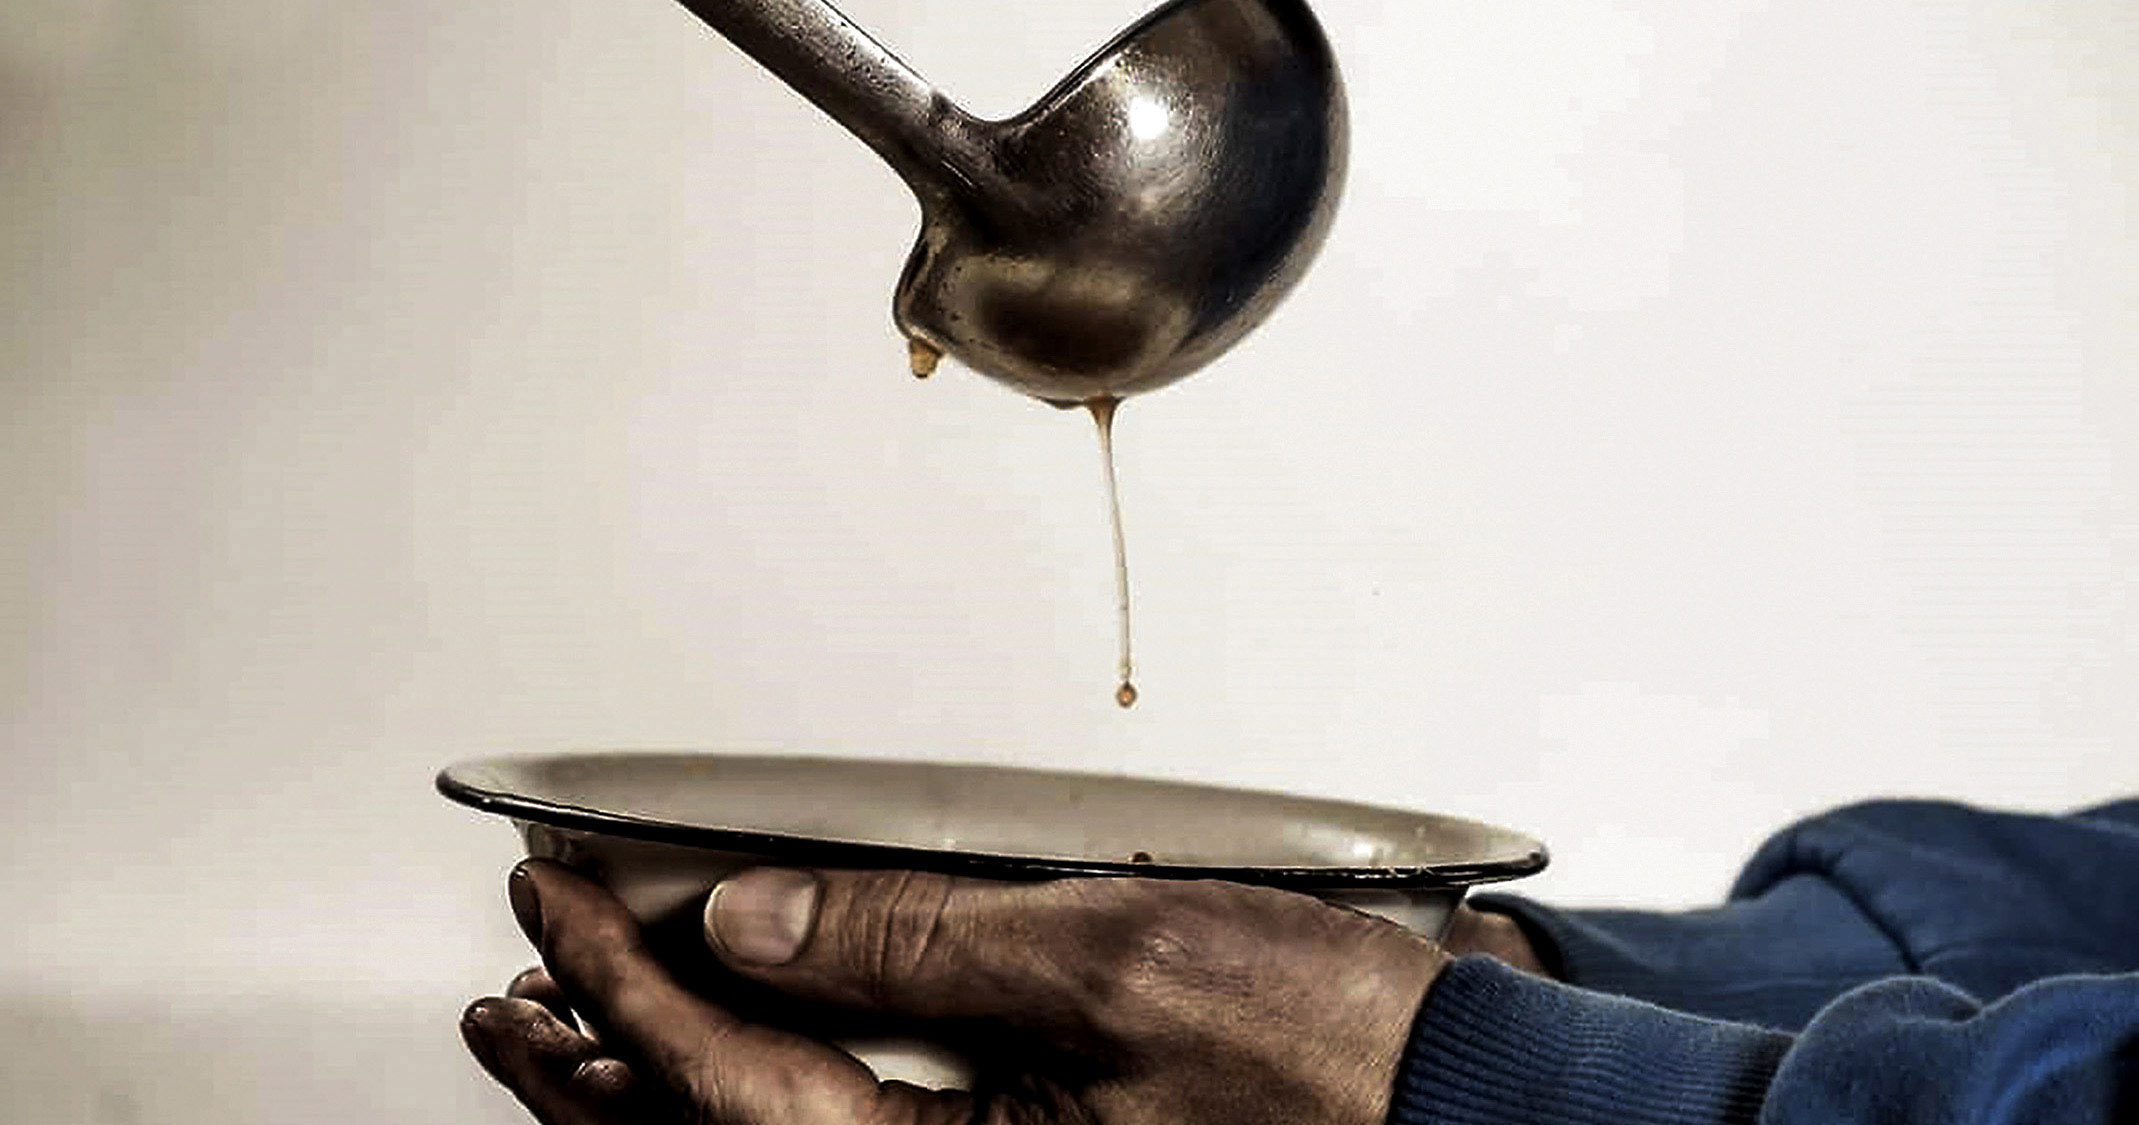
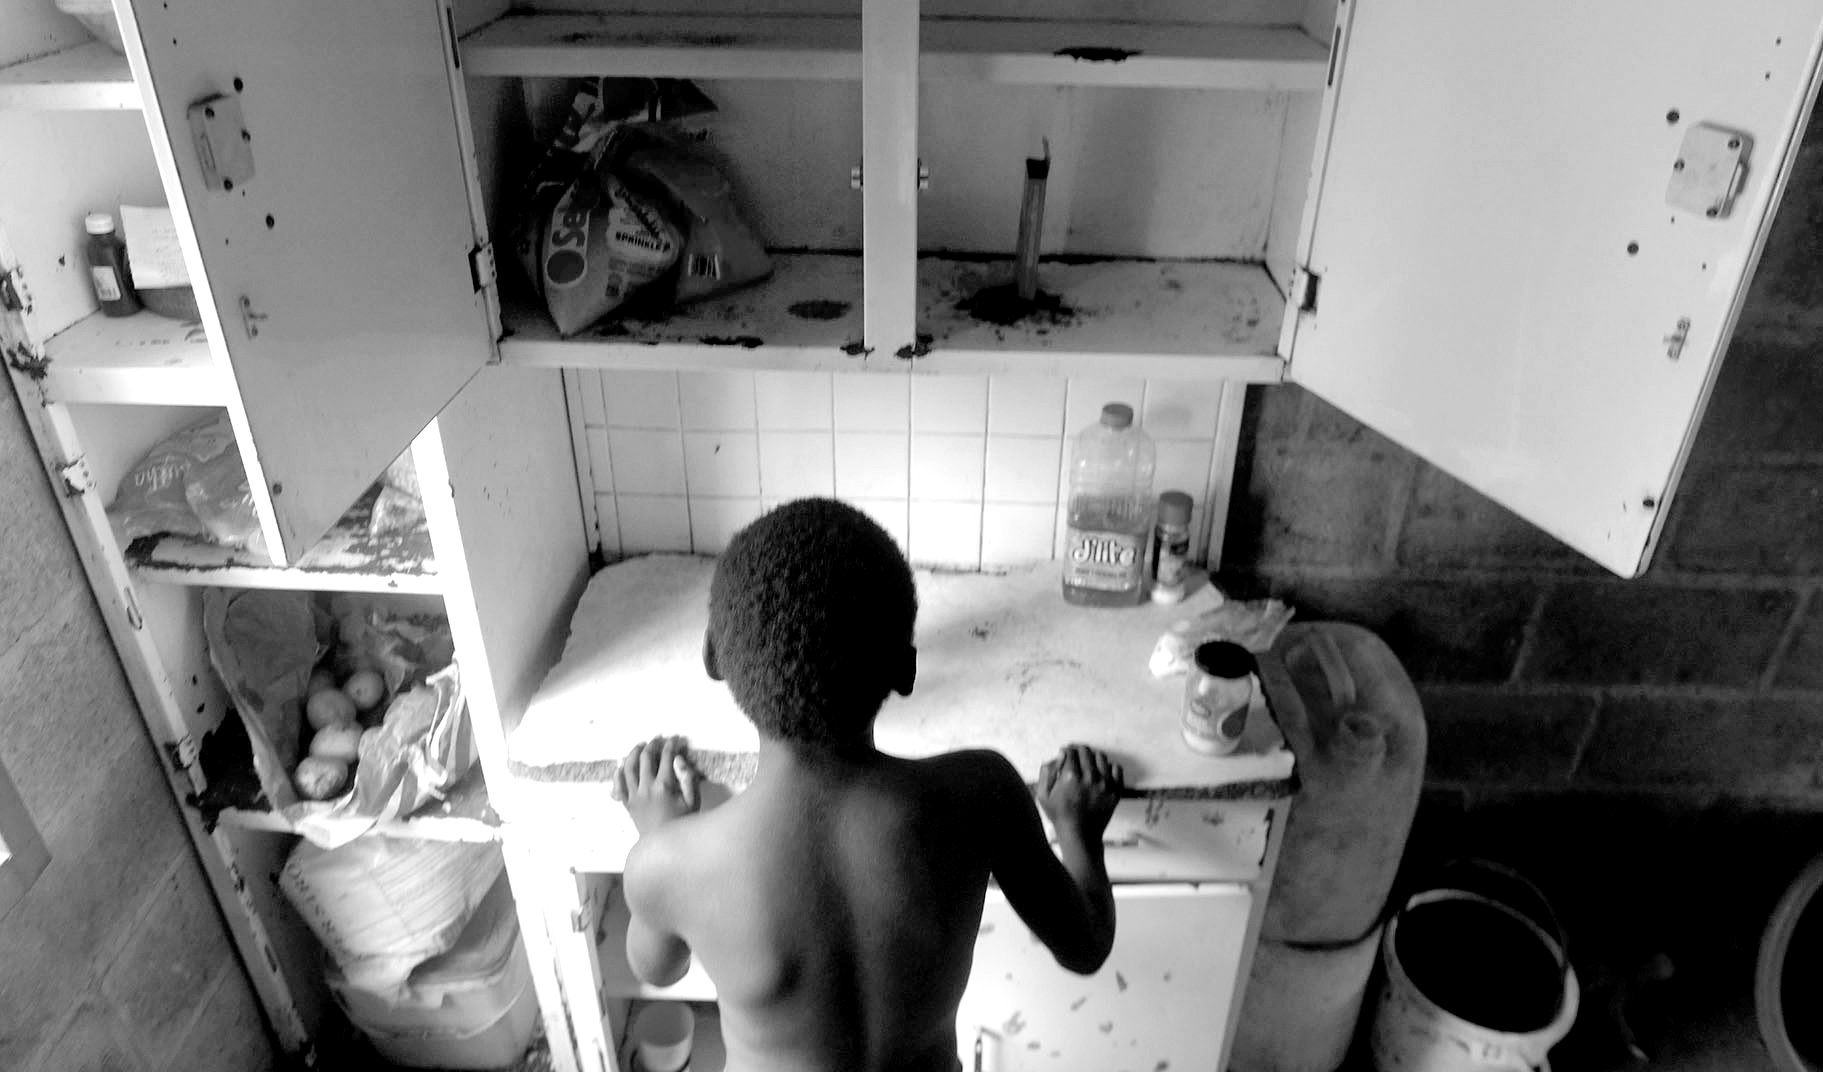 Roughly 6% of South African households (about 1.12 million households) had ‘severely inadequate access to food’. (Photo: Black Star / Spotlight)
It found that roughly 6% of South African households (about 1.12 million households) had “severely inadequate access to food”. A further 15% (about 2.6 million households) had “inadequate” access to food. These households represent millions of South Africans.
To determine whether a household had adequate access to food, the GHS asked respondents whether, in the 12 months before the survey, there had been times when their household had been “unable to eat healthy and nutritious food because of lack of money or other resources” or “had to skip a meal because of lack of money or other resources”.
Households that answered “yes” to at least two of the eight questions were considered to have “inadequate” access to food. Those who answered yes to at least six were considered to have “severely inadequate access to food”.
In response to Africa Check’s queries, Rise Mzansi quoted the 2021 GHS and also pointed out that 11.6% of households were identified as being “vulnerable to hunger” in that survey. This figure remained the same in 2022.
Claim: “There are more cases of food insecurity and hunger today than there were in 1994.”
Verdict: Unproven
First, this claim is less straightforward than the previous one, as Rise Mzansi acknowledged: “It is difficult to determine how the nature of hunger and/or food insecurity has changed since 1994, as there are not consistent measures of hunger and malnutrition from that period to now.”
To support this statement, the party pointed us to a 2017 press release from the University of Pretoria. This said that a review of 169 surveys on food insecurity in South Africa found that most “used one or more of 27 different measures of food insecurity”.
But as evidence of this claim, Rise Mzansi also said: “The Food and Agriculture Organization’s measure of the prevalence of food inadequacy, which looks at the percentage of people who have sufficient calories for physical activity stood at 23% of the population in 1994.
“But this measure does not encompass all aspects of food insecurity and hunger. The Sanhanes research uses a wider measure of food insecurity and hunger and found that in 2013 the proportion of people at risk of hunger may have increased to 28%.”
The South African National Health and Nutrition Examination Survey, or Sanhanes, was carried out in 2012.
This answer, however, is copied almost word for word from a paragraph in a 2014 report by the international charity Oxfam. But Rise Mzansi omitted two key clauses.
The first said that the percentage of people with enough calories for physical activity had “declined to under 10% in 2012” from the 23% recorded by the United Nations’ Food and Agriculture Organization (FAO) in 1994. The second, regarding the Sanhanes data, said that “food insecurity, or hunger, has halved since 1999, but that the level has stagnated since 2008 and remains at 26%”.
This suggests that food insecurity or hunger was less than 26% in 1999. This data contradicts Rise Mzansi’s claim, but the Oxfam report was published a decade ago. So we looked for more recent statistics.
Data mostly point to lower prevalence of hunger, but not all agree
The GHS only started in 2002, but its predecessor, the October Household Survey (OHS), was conducted until 1999. In 1994, 41% of SA households reported that there had been a time in the past year when there was not enough money to feed the children in the household. This fell to 31.7% the following year.
The latest GHS found that only 12.9% of people and 11.6% of households in 2022 were “vulnerable to hunger”.
While both the OHS and GHS ask similar questions about access to food, as we’ve written before, they are not entirely compatible.
Neil Roux, Stats SA’s director of service delivery statistics, told Africa Check that “comparing data from the GHS with the OHS remains tricky due to variations between the samples used between 1993 and 1999 together with issues related to the questionnaire design”.
Despite some work to make the OHS and GHS data more compatible, these and other differences cause difficulties when comparing the surveys.
Conflicting data from trustworthy sources
The latest GHS itself shows a pattern in which vulnerability to hunger has mostly declined over the past two decades, from 24.2% in 2002, apart from a brief increase during the Covid pandemic.
The graph below, taken from the 2022 GHS, shows this pattern, as well as a corresponding pattern in what Stats SA calls “complex food access”. This is a measure of food access based on several questions about a household’s access to food over the past 12 months.
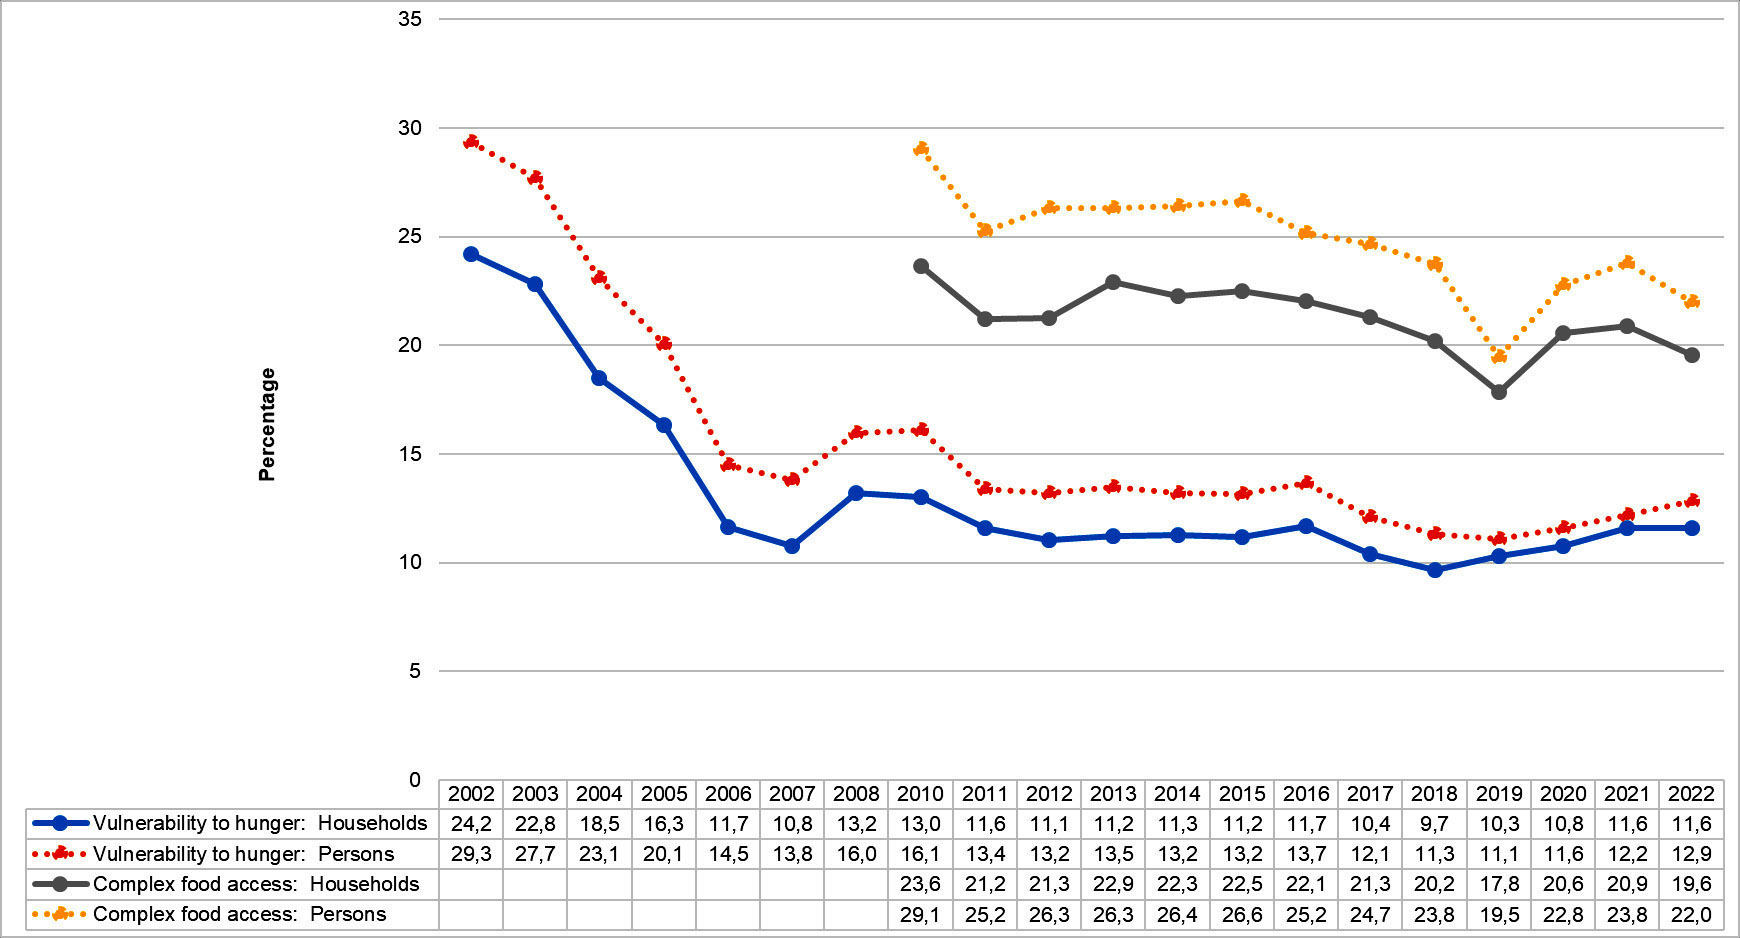 GHS2022 Hunger Chart. (Source: Supplied)
The FAO has however found an increase in food insecurity. According to the UN agency, the prevalence of severe and moderate food insecurity in South Africa has increased from a three-year average of 17.4% in 2017-2019 to 20.3% in 2020-2022. But there are some caveats to this.
The FAO uses data from the Gallup World Poll, which asks the same questions as the GHS. However, whereas the Gallup poll consists of “at least 1,000 surveys of individuals”, the GHS surveyed 19,351 households in 2022. Of the two, the general household survey is more likely to be reliable and representative of South Africa.
Without being able to compare recent data with historical figures, we rate the claim unproven. At Africa Check, we use this rating when publicly available information neither proves nor disproves the claim. DM
This report is part of the work of a South African election coalition. In the run-up to the 2024 national elections, the coalition aims to ensure that the claims made by those in charge of state resources and delivering essential services are factually accurate. As voters head to the polls, it is increasingly important that they are able to make informed decisions.
Read more from Africa Check:
- ‘Democracy’s child’: fact-checking Cyril Ramaphosa’s 2024 State of the Nation Address
- Promises, promises: Following up on Cyril Ramaphosa’s 2023 State of the Nation pledges
- Fact-checking the ANC’s January 8th claims about progress – and what the party said in response