All Article Properties:
{
"access_control": false,
"status": "publish",
"objectType": "Article",
"id": "62627",
"signature": "Article:62627",
"url": "https://staging.dailymaverick.co.za/article/2016-07-04-how-do-we-live-annual-survey-reveals-the-improvements-and-hardships-ordinary-south-africans-face/",
"shorturl": "https://staging.dailymaverick.co.za/article/62627",
"slug": "how-do-we-live-annual-survey-reveals-the-improvements-and-hardships-ordinary-south-africans-face",
"contentType": {
"id": "1",
"name": "Article",
"slug": "article"
},
"views": 0,
"comments": 0,
"preview_limit": null,
"excludedFromGoogleSearchEngine": 0,
"title": "How do we Live: Annual survey reveals the improvements and hardships ordinary South Africans face",
"firstPublished": "2016-07-04 00:58:31",
"lastUpdate": "2016-07-04 01:51:51",
"categories": [
{
"id": "29",
"name": "South Africa",
"signature": "Category:29",
"slug": "south-africa",
"typeId": {
"typeId": "1",
"name": "Daily Maverick",
"slug": "",
"includeInIssue": "0",
"shortened_domain": "",
"stylesheetClass": "",
"domain": "staging.dailymaverick.co.za",
"articleUrlPrefix": "",
"access_groups": "[]",
"locale": "",
"preview_limit": null
},
"parentId": null,
"parent": [],
"image": "",
"cover": "",
"logo": "",
"paid": "0",
"objectType": "Category",
"url": "https://staging.dailymaverick.co.za/category/south-africa/",
"cssCode": "",
"template": "default",
"tagline": "",
"link_param": null,
"description": "Daily Maverick is an independent online news publication and weekly print newspaper in South Africa.\r\n\r\nIt is known for breaking some of the defining stories of South Africa in the past decade, including the Marikana Massacre, in which the South African Police Service killed 34 miners in August 2012.\r\n\r\nIt also investigated the Gupta Leaks, which won the 2019 Global Shining Light Award.\r\n\r\nThat investigation was credited with exposing the Indian-born Gupta family and former President Jacob Zuma for their role in the systemic political corruption referred to as state capture.\r\n\r\nIn 2018, co-founder and editor-in-chief Branislav ‘Branko’ Brkic was awarded the country’s prestigious Nat Nakasa Award, recognised for initiating the investigative collaboration after receiving the hard drive that included the email tranche.\r\n\r\nIn 2021, co-founder and CEO Styli Charalambous also received the award.\r\n\r\nDaily Maverick covers the latest political and news developments in South Africa with breaking news updates, analysis, opinions and more.",
"metaDescription": "",
"order": "0",
"pageId": null,
"articlesCount": null,
"allowComments": "1",
"accessType": "freecount",
"status": "1",
"children": [],
"cached": true
}
],
"content_length": 6828,
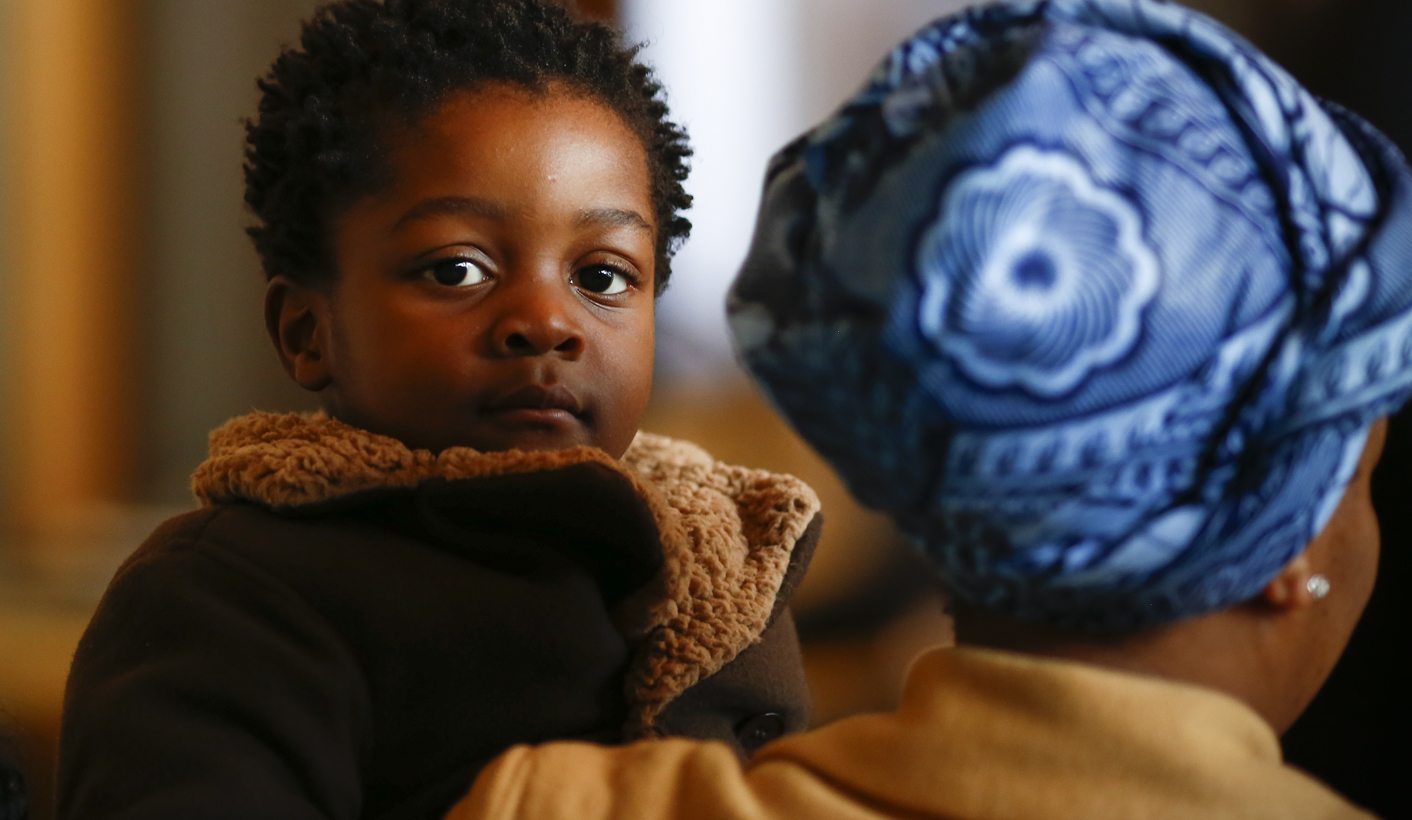
"contents": "\r\n<p><span style=\" font-size: 12pt; font-family: georgia, palatino;\"><span>Like access to electricity, access to piped water and sanitation is up for South Africa’s 16.9-million households. Two-million more households, or 15.2-million, now have access to water compared to 2011. And just over 10.3-million households, or 60.6%, have access to a flush toilet – almost double compared to statistics recorded in 2001. </span></span></p>\r\n<p><span style=\" font-size: 12pt; font-family: georgia, palatino;\"><span>But the devil is in the detail – and a much more nuanced picture emerges.</span></span></p>\r\n<p><span style=\" font-size: 12pt; font-family: georgia, palatino;\"><span>While access to piped water increased, just 7.5-million households actually have water inside their homes, about 800,000 households more than in 2011. The boost in water access has come on the back of providing taps in yards. In 2016 there were 5.5-million households with piped water in the yard, up from 3.9-million in 2011 and 1.49-million in 1996. Just 4.7-million households own a geyser for hot water.</span></span></p>\r\n<p><span style=\"font-family: georgia, palatino; font-size: 12pt;\"><span >Geography is a key factor the survey highlights throughout. While well over half of Gauteng households have water inside their homes, and 1.48-million of the 1.93-million Western Cape households, only about one in three households in the Eastern Cape and KwaZulu-Natal have access to water inside their home. The rate drops to approximately one in four households in North West and Mpumalanga. </span><span >Households that reported no access to piped water are highest in the Eastern Cape (24.9%) and Limpopo (20.0%).</span></span></p>\r\n<p><span style=\" font-size: 12pt; font-family: georgia, palatino;\"><span>Access to safe, reliable water emerged as the top municipal challenge, cited by 2,683,048 households countrywide. Geographic variations again emerge: 43.9% of Limpopo households raised safe, reliable water as a concern as did 33.4% in the North West, but this did not feature in Gauteng and the Western Cape, the two provinces with the highest level of piped water connections.</span></span></p>\r\n<p><span style=\" font-size: 12pt; font-family: georgia, palatino;\"><span>On the sanitation front, 49.5% of households have toilets in the yard, 45.6% have a toilet inside their homes, but 409,881 household have no sanitation whatsoever. Just over 4.3-million households still rely on pit latrines, ventilated or not, while the use of chemical toilets has more than doubled to 4.2% in 2016, up from 1.9% two decades ago. </span></span></p>\r\n<p><span style=\"font-family: georgia, palatino; font-size: 12pt;\"><span >And while electricity provision has soared from 58.1% two decades ago, it continues to highlight the legacy of apartheid. The survey showed 46.6% of households receive their power directly from Eskom – the power utility before democracy directly supplied townships and bantustans – while just 38.7% of households are connected directly to the municipality. </span></span></p>\r\n<p><span style=\"font-family: georgia, palatino; font-size: 12pt;\"><span >The use of pre-paid meters has increased over the past five years. Overall, the Western Cape recorded the highest level of electricity connections (97%) and the Eastern Cape the least (86.8%). The Community Survey 2016 noted a 0.7% drop in electricity use by households in </span><span >Gauteng, South Africa’s economic powerhouse.</span></span></p>\r\n<p><span style=\" font-size: 12pt; font-family: georgia, palatino;\"><span>One explanation may be found elsewhere in the community survey. Gauteng – geographically the smallest, but population-wise the largest province – continues to attract most in-country migrants, even if the trend has slowed down compared to five years ago. The Western Cape emerged as the second most attractive to in-country migrants.</span></span></p>\r\n<p><span style=\" font-size: 12pt; font-family: georgia, palatino;\"><span>Community Survey 2016 shows the Eastern Cape loosing the most residents – 1.59-million left leading to a 1.2% drop of household numbers over the past five years to 1.773-million – followed by Limpopo, which lost 1.17-million people. </span></span></p>\r\n<p><span style=\" font-size: 12pt; font-family: georgia, palatino;\"><span>Reasons for migration are topped by establishing new households and moving to be closer to relatives and friends, followed by education and under- or unemployment. </span></span></p>\r\n<p><span style=\" font-size: 12pt; font-family: georgia, palatino;\"><span>Lack of employment, the second most cited challenge, emerged across provinces – from as little as 9.4% of Western Cape households to 14.4% of households in KwaZulu-Natal.</span></span></p>\r\n<p><span style=\" font-size: 12pt; font-family: georgia, palatino;\"><span>On the education front, the survey shows improved, almost universal primary enrolment and significantly boosted secondary school completion numbers to 11.88-million by 2016, up from 3.75-million in 1996. Although absolute number of university graduates has increased to 1,235 250, compared to 410,686 two decades ago, the proportion of graduates to school leavers and in relation to overall population has not shifted upwards in any significant way.</span></span></p>\r\n<p><span style=\" font-size: 12pt; font-family: georgia, palatino;\"><span>The country’s population now stands at 55,653,654, up three-million from five years ago. There are 16,923,309 households, up from 14.45,million in 2011. Gauteng accounts for 29.3% or 4.951-million households, followed by KwaZulu-Natal (2.87-million households) and the Western Cape (1.93-million households). There are 353,000 households in the Northern Cape, the least populated province despite being the largest geographically.</span></span></p>\r\n<p><span style=\" font-size: 12pt; font-family: georgia, palatino;\"><span>As with basic services, variations emerge with respect to poverty indicators (head count and intensity) even within provinces like the Western Cape, which recorded the least poverty from among all nine provinces. However, while the provincial average stood at 2.7%, a look at municipal level showed significantly higher poverty in Cederberg (3.6%). Although the poverty headcount overall in Gauteng stood at 4.6%, poverty intensity indicators showed only marginal decreases in Johannesburg and Tshwane as Ekurhuleni experienced a 0.3% increase in poverty intensity.</span></span></p>\r\n<p><span style=\" font-size: 12pt; font-family: georgia, palatino;\"><span>Although poverty overall is somewhat down, it remained unchanged in the Free State at 5.5% and Limpopo bucked the trend with a rise in the poverty headcount to 11.5%, up from 10.1% in 2011.</span></span></p>\r\n<p><span style=\"font-family: georgia, palatino; font-size: 12pt;\"><span >On average one in five households countrywide said they had run out of money for food in the year before the survey, and an average 2.2-million households said </span><span ><span >they had skipped at</span></span><span > least one meal in that time. However, in the Eastern Cape 17.6% of households had skipped a meal, followed by the Northern Cape (17.5%), North West (17.4%), Free State (15.7%), KwaZulu-Natal and Mpumalanga (both at 14.8%), Limpopo (12.9%), Gauteng (10.8%) and the Western Cape (8.4%).</span></span></p>\r\n<p><span style=\" font-size: 12pt; font-family: georgia, palatino;\"><span>Community Survey 2016 was conducted between March and April 2016 to collect data from 1.3-million identified representative households. According to Statistics South Africa the aim is to bridge the information gap between censuses. </span></span></p>\r\n<p><span style=\" font-size: 12pt; font-family: georgia, palatino;\">“<span>It is one of the few available data sources that provide statistics at municipal level and it is aimed at enhancing planning, monitoring and evaluation,” according to Statistics South Africa. </span></span></p>\r\n<p><span style=\" font-size: 12pt; font-family: georgia, palatino;\"><span>The survey provides a range of detailed information – from cellphone ownership (93.8% of households), the number of cattle, sheep, chicken and goats owned by whom and where, agricultural activity (backyard gardening for food security mostly in the Eastern Cape and Limpopo) to a third of South Africans not feeling safe at night. </span></span></p>\r\n<p><span style=\"font-family: georgia, palatino; font-size: 12pt;\"><span >It’s now up to policy-makers, and those who implement policy, to set aside politicking to make decisive interventions in one of the world’s most unequal societies. </span><span ><span style=\"text-decoration: underline;\"><b>DM</b></span></span></span></p>\r\n<p><span style=\"font-family: georgia, palatino; font-size: 12pt;\"><span><i><span ><span >Photo: </span></span><span >A South African boy with his mother during a Youth Health Festival on Youth Day in Cape Town, South Africa 16 June 2016. EPA/NIC BOTHMA</span></i></span></span></p>\r\n",
"teaser": "How do we Live: Annual survey reveals the improvements and hardships ordinary South Africans face",
"externalUrl": "",
"sponsor": null,
"authors": [
{
"id": "896",
"name": "Marianne Merten",
"image": "https://www.dailymaverick.co.za/wp-content/uploads/Marianne-Merten-1.jpg",
"url": "https://staging.dailymaverick.co.za/author/mariannemerten/",
"editorialName": "mariannemerten",
"department": "",
"name_latin": ""
}
],
"description": "",
"keywords": [
{
"type": "Keyword",
"data": {
"keywordId": "2083",
"name": "South Africa",
"url": "https://staging.dailymaverick.co.za/keyword/south-africa/",
"slug": "south-africa",
"description": "",
"articlesCount": 0,
"replacedWith": null,
"display_name": "South Africa",
"translations": null
}
},
{
"type": "Keyword",
"data": {
"keywordId": "2760",
"name": "Africa",
"url": "https://staging.dailymaverick.co.za/keyword/africa/",
"slug": "africa",
"description": "",
"articlesCount": 0,
"replacedWith": null,
"display_name": "Africa",
"translations": null
}
},
{
"type": "Keyword",
"data": {
"keywordId": "4379",
"name": "Geography of Africa",
"url": "https://staging.dailymaverick.co.za/keyword/geography-of-africa/",
"slug": "geography-of-africa",
"description": "",
"articlesCount": 0,
"replacedWith": null,
"display_name": "Geography of Africa",
"translations": null
}
},
{
"type": "Keyword",
"data": {
"keywordId": "5302",
"name": "Commonwealth of Nations",
"url": "https://staging.dailymaverick.co.za/keyword/commonwealth-of-nations/",
"slug": "commonwealth-of-nations",
"description": "",
"articlesCount": 0,
"replacedWith": null,
"display_name": "Commonwealth of Nations",
"translations": null
}
},
{
"type": "Keyword",
"data": {
"keywordId": "6987",
"name": "Natal",
"url": "https://staging.dailymaverick.co.za/keyword/natal/",
"slug": "natal",
"description": "",
"articlesCount": 0,
"replacedWith": null,
"display_name": "Natal",
"translations": null
}
},
{
"type": "Keyword",
"data": {
"keywordId": "9571",
"name": "Water Board",
"url": "https://staging.dailymaverick.co.za/keyword/water-board/",
"slug": "water-board",
"description": "",
"articlesCount": 0,
"replacedWith": null,
"display_name": "Water Board",
"translations": null
}
}
],
"short_summary": null,
"source": null,
"related": [],
"options": [],
"attachments": [
{
"id": "65178",
"name": "",
"description": "",
"focal": "50% 50%",
"width": 0,
"height": 0,
"url": "https://dmcdn.whitebeard.net/dailymaverick/wp-content/uploads/Merten-community-survey.jpg",
"transforms": [
{
"x": "200",
"y": "100",
"url": "https://dmcdn.whitebeard.net/i/2_JIHKKUoxjDhclb0vJDIavZc7I=/200x100/smart/filters:strip_exif()/file/dailymaverick/wp-content/uploads/Merten-community-survey.jpg"
},
{
"x": "450",
"y": "0",
"url": "https://dmcdn.whitebeard.net/i/Ds0gYKriCYydHUzh4_j-hi3kBvw=/450x0/smart/file/dailymaverick/wp-content/uploads/Merten-community-survey.jpg"
},
{
"x": "800",
"y": "0",
"url": "https://dmcdn.whitebeard.net/i/jc1WxY1L_CNTFWk_CFdh6hYFvYY=/800x0/smart/filters:strip_exif()/file/dailymaverick/wp-content/uploads/Merten-community-survey.jpg"
},
{
"x": "1200",
"y": "0",
"url": "https://dmcdn.whitebeard.net/i/a6Fxo1vk7zsbEnP6bae8QxPWc5I=/1200x0/smart/filters:strip_exif()/file/dailymaverick/wp-content/uploads/Merten-community-survey.jpg"
},
{
"x": "1600",
"y": "0",
"url": "https://dmcdn.whitebeard.net/i/CxPjkHE4hK-kjHTQcxDxeKB9l8w=/1600x0/smart/filters:strip_exif()/file/dailymaverick/wp-content/uploads/Merten-community-survey.jpg"
}
],
"url_thumbnail": "https://dmcdn.whitebeard.net/i/2_JIHKKUoxjDhclb0vJDIavZc7I=/200x100/smart/filters:strip_exif()/file/dailymaverick/wp-content/uploads/Merten-community-survey.jpg",
"url_medium": "https://dmcdn.whitebeard.net/i/Ds0gYKriCYydHUzh4_j-hi3kBvw=/450x0/smart/file/dailymaverick/wp-content/uploads/Merten-community-survey.jpg",
"url_large": "https://dmcdn.whitebeard.net/i/jc1WxY1L_CNTFWk_CFdh6hYFvYY=/800x0/smart/filters:strip_exif()/file/dailymaverick/wp-content/uploads/Merten-community-survey.jpg",
"url_xl": "https://dmcdn.whitebeard.net/i/a6Fxo1vk7zsbEnP6bae8QxPWc5I=/1200x0/smart/filters:strip_exif()/file/dailymaverick/wp-content/uploads/Merten-community-survey.jpg",
"url_xxl": "https://dmcdn.whitebeard.net/i/CxPjkHE4hK-kjHTQcxDxeKB9l8w=/1600x0/smart/filters:strip_exif()/file/dailymaverick/wp-content/uploads/Merten-community-survey.jpg",
"type": "image"
}
],
"summary": "Access to electricity, now at 90.3% nationally, has emerged as one of the delivery accomplishments in the Community Survey 2016. And these electricity connections have boosted ownership of fridges to 81.8% of South African households, up from 68.4% recorded in Census2011, and electric stove ownership to 84.4% from 77% over the same five-year period. However, the Community Survey released by Statistics South Africa on Thursday evening also shows significant challenges – the cost of electricity has emerged as the third biggest worry by households after access to safe, reliable water and the lack of employment. By MARIANNE MERTEN.",
"template_type": null,
"dm_custom_section_label": null,
"elements": [],
"seo": {
"search_title": "How do we Live: Annual survey reveals the improvements and hardships ordinary South Africans face",
"search_description": "\r\n<p><span style=\" font-size: 12pt; font-family: georgia, palatino;\"><span>Like access to electricity, access to piped water and sanitation is up for South Africa’s 16.9-million households. Two-millio",
"social_title": "How do we Live: Annual survey reveals the improvements and hardships ordinary South Africans face",
"social_description": "\r\n<p><span style=\" font-size: 12pt; font-family: georgia, palatino;\"><span>Like access to electricity, access to piped water and sanitation is up for South Africa’s 16.9-million households. Two-millio",
"social_image": ""
},
"cached": true,
"access_allowed": true
}