


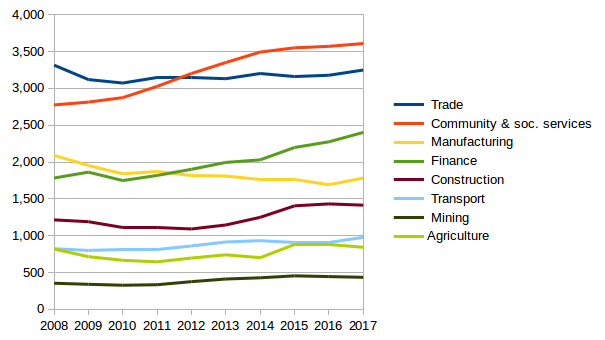
 Changes in employment by sector 2008 to 2017. Data from Stats SA’s QLFS, averaged per year to smooth out quarterly changes in employment. (Y-axis unit is 1000s.)
 First published by GroundUp
Unemployment in South Africa increased from 23.2% to 26.7% between the first quarters of 2008 and 2018. The actual number of jobs increased from 14.4-million to 16.4-million, but the number of people wanting to work (the labour force) increased much faster, from 20.9-million to 25.9-million.
What’s interesting is how employment in South Africa has changed. Critically, the number of jobs in manufacturing and services has dropped. Jobs in mining, construction and transport have increased, but not as fast as the working-age population.
 Changes in employment by sector 2008 to 2017. Data from Stats SA’s QLFS, averaged per year to smooth out quarterly changes in employment. (Y-axis unit is 1000s.)
In three sectors – utilities, communities and social services – jobs have grown faster than the growth in the working-age population. Many of these jobs are in government. Given how poorly government has been performing in so many areas, it’s an interesting question how much these new jobs are benefiting the country.
|
Sector |
Jan-March 2008 (1000s) |
Jan-March 2018 (1000s) |
Change |
|---|---|---|---|
|
Trade |
3,319 |
3,276 |
1% |
|
Community and social services |
2,714 |
3,785 |
39% |
|
Manufacturing |
2,111 |
1,849 |
14% |
|
Finance |
1,780 |
2,402 |
35% |
|
Construction |
1,181 |
1,431 |
21% |
|
Agriculture |
838 |
847 |
1% |
|
Transport |
808 |
960 |
19% |
|
Mining |
353 |
397 |
13% |
|
Utilities |
102 |
143 |
40% |
|
Other |
0 |
12 |
|
|
Total employed |
14,438 |
16,378 |
13% |
|
Labour force |
20,891 |
25,858 |
24% |
|
Population aged 15-64 |
31,544 |
37,678 |
19% |
Employment in January to March 2008 compared to January to March 2018.Jobs in trade (service industry) and manufacturing have decreased. Although jobs in transport and mining have increased, they have done so at a much slower rate than the rate of increase in the working-age population. Source: Statistics South Africa’s QLFS
South Africa’s financial sector punches far above the weight of a typical middle-income country like ours. And the number of jobs in the sector has grown dramatically. DM