


 Diagram from the 1996 Budget Review.

Tim Cohen writes that it would be both unfair and counterproductive to introduce “a wealth tax”. He quotes Judge Dennis Davis saying “while a wealth tax would add to the legitimacy of the tax system in a country with such vast inequality, it would require significant institutional capacity that can’t just be switched on like a light”.
Davis talked about the difficulty of implementing a completely new tax on hoarded wealth. This has nothing to do with Cohen’s complaints against the personal income tax (PIT), which is what his whole article is about.
First, Cohen argues that the PIT on high-income earners has become harder and harder.
Second, he believes that an increase of the PIT only would give more “incentive” to tax avoidance and lead to lower tax collections.
Third, Cohen claims that a key fiscal policy measure – tax revenue as a percentage of gross domestic product (GDP) – has increased dramatically since 2000.
Has taxation of personal incomes become harder and harder over the years?
Every year, the compilers of Tax Statistics issued by SARS and the National Treasury (NT) update a table and diagram that show the development of PIT in SA. In the 2019 edition, this information is on page 36.
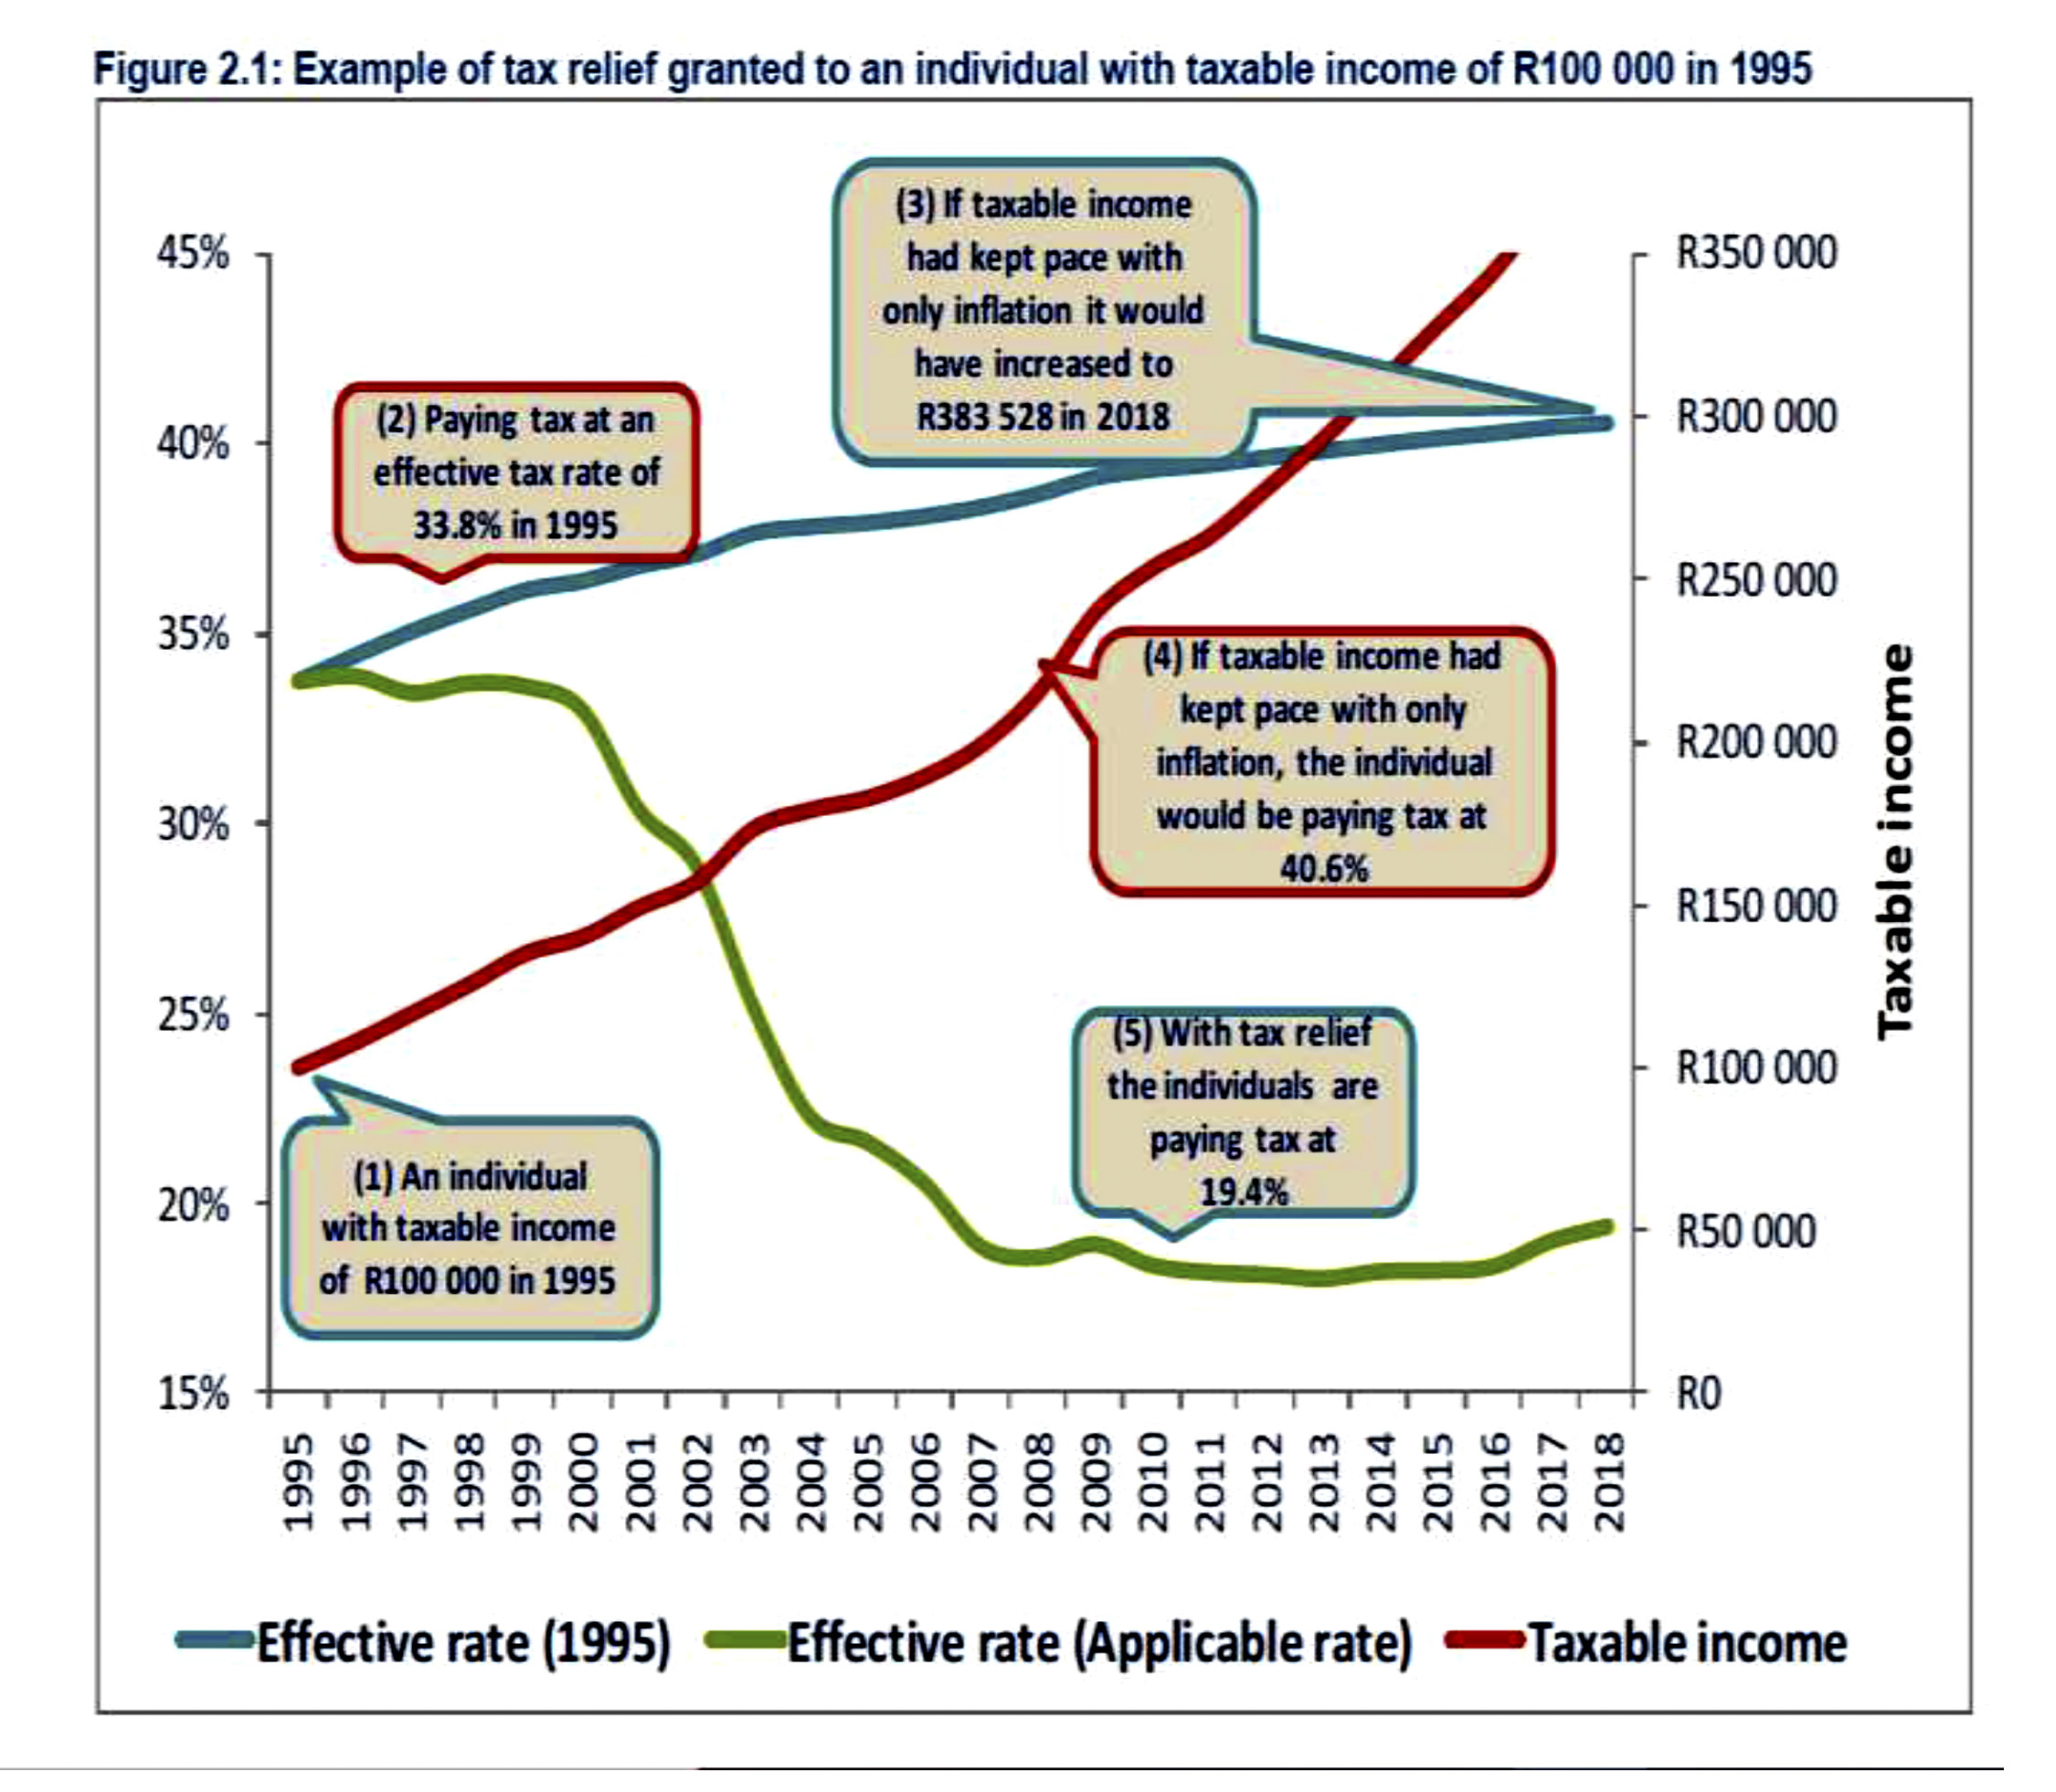 Diagram on page 36 in 2019 Tax Statistics (SARS and NT)
The red line in the diagram reports that a taxable income of R100,000 in 1995 was equal to R383,528 in buying power in 2018, taking Consumer Price Index (CPI) into account.
The green line reports that this annual taxable income worth R100,000 in 1995 and R383,528 in 2018 was taxed at a rate close to 34% in 1995-2000 (when the green line is flat), but at 20% in 2018.
With the help of an additional “tax relief’ table in Tax Statistics, we can also calculate how personal income taxation has developed since 1995-2000 for all taxable incomes above the PIT threshold, which is R83,100 right now
We have used the 2019 and 2017 Tax Statistics to create two schedules in a diagram. They show the lower taxation rate compared to 1995-2000, that is before and after what Cohen calls “a full-on assault on the rich”. By this Cohen refers to the reintroduction in 2017 of the 45% tax bracket for the part of the taxable income that is above R1.5-million.
 Quick tax cut reference guide (Table 2.2 in 2019 Tax Statistics and own calculations)
To the left is the lower PIT in 2016 or 2018 compared to effective taxation in 1995, save for the 12-month short “transition tax” in 1995-96, not considered by Tax Statistics.
Taxable income is what is left after the amount allowed for deductions from one’s total income before it is taxed; including a sizable part of the expenses for private health used by some 16% of the population. So it isn’t a lifestyle audit. But it gives an indication of living standards. By adjusting the taxable incomes for inflation, Tax Statistics basically compares changes in taxation of living standards since 1995.
To use the quick tax cut reference guide in Diagram 1: Go straight up from the chosen taxable income at the bottom, to a point on the schedule for 2016 or 2018. Read what the tax cut is on the scale to the left compared to the tax policy of 1995-2000.
Someone with a taxable income of R2-million in 2018, paid R80,000 less in tax that year because of drastically reduced personal income taxation after 2000.
The difference between the two tax cut schedules in Diagram 1 is caused by the 45% tax rate reintroduced in 2017 for the part of the income that exceeds R1.5-million; that one percentage point was added to all other tax brackets, except the lowest; and that tax brackets were not adjusted upwards at the full rate of inflation. This reform took away one third of the historical tax relief given to the R2-million lifestyle (equal to about R521,500 in 1995). In 2016, tax was R120,000 lower for this person compared to what it would have been in the 1995-2000 period.
The top 45% tax rate was abolished in two steps in 2000 and 2001. But the main factor behind the lower tax rates was eight years of moving tax brackets upwards above the rate of inflation. In 2005, the inflation rate was 4%, but the top tax bracket was lifted from R300,000 to R400,000, that is by 33%. It amounted to a tax cut revolution.
Using the report in Table A2.1.1 in 2019 Tax Statistics – extrapolating that report from 75% to 90-100% assessed tax forms – the total tax revenue forfeited in the 2018 tax year alone, because of the drastic policy change, can be estimated to between R145-R160-billion.
But, in line with Cohen’s argument, wouldn’t it have increased tax dodging to have kept effective taxation rates as they were in 1995-2000? One must answer: no. This is because personal income taxation, simply left as it is, will not lead to more (or less) tax dodging. If there is no tax policy change, tax dodging is not provoked in any direction. Tax dodging will then only be influenced up or down by other factors (like better capability at SARS (down), or less moral authority of the state (up).
‘Increased tax rates give nothing’?
And if tax rates are increased?
On that point, Cohen reports that SARS in 2018 “scooped R20.4-billion less than expected in personal tax”. He blames this exclusively on the reintroduction of the 45% tax bracket: “Increasing the tax rate garnered exactly nothing.”
However, the 2018 Budget Review gives a mix of factors behind the failed forecast. There was a recession in 2017: “Lower bonus payments, moderate wage settlements, continued job losses and a stabilisation of overall public service employment”, etc.
The Treasury authors finally add that “increased avoidance in response to tax increases may also be playing a role” and diplomatically on another page they refer to “administrative challenges at SARS”.
Notably, there had been an exodus of over 2,000 staff from SARS since 2015. Senior officials were already resigning in droves from 2014/15. Tax evasion and avoidance is a game played by two. If tax dodging is constant, but the control of tax forms is collapsing, the result will be lower tax collections. That is why we should give SARS Commissioner Kieswetter the R800-million he has asked for to fill critical posts that have been vacant since the State Capture purge.
Let us then see what happens to tax evasion theory at business schools.
Tax revenue to GDP – a history
Let us now deal with Cohen’s third claim, where he cites numbers that would be sensational if they were true: “In 2000, SA’s tax rate in relation to its GDP was 22.4%. That has risen steadily over the past two decades, and it reached 29.1% in 2018,” he writes.
This measure is usually reported in Chapter 4 of the Budget Review. In Diagram 2 below, we have controlled and corrected it for consistency over time.
Before 2010, payments to the Southern African Customs Union (SACU) had, for example, been subtracted from total tax revenue before giving the ratio to GDP.
It is not really correct and it is not done like that today.
Cohen’s tax ratio for 2000 is about two-and-a-half percentage points lower than that reported in the Budget Review. The 2020 Budget Review reports the tax to GDP ratio in 2018/19 at 26.2%, not Cohen’s 29.1% .
Below is tax revenue history up until today. The bubble over the years 2006-2009 reflects the commodity boom before the finance crash. That aside, the tax to GDP measure is remarkably steady.
At most, one can speak of a growth by two percentage points, to 26% tax revenue to GDP over the 30 years going all the way back to 1990.
 Thirty years of ‘Tax revenue to GDP’ in South Africa
The Growth Employment and Redistribution (Gear) document of 1996 set out to “avoid permanent increases in the overall tax burden”. In the paragraph below, the first sentence contradicted the second:
“The improvement in economic growth, together with improved tax administration, should lead to a strong increase in tax revenue relative to GDP. This will create considerable scope to effect further reductions in the rates of personal and corporate taxation, while maintaining a ratio of tax to GDP of about 25 percent.”
You cannot both “increase tax revenue relative to GDP” and keep it at “about 25 percent”. We saw that the government went for “further reductions in the rates of personal and corporate taxation” (the latter was 35% in 1994 and 28% in 2010).
The “25 percent tax ratio” benchmark stayed on. In his 2012 Budget Speech, Finance Minister Pravin Gordhan wanted “tax revenue stabilising at about one-quarter of GDP”, as one of five key points in “the budget framework”.
In the 2000s, the new SARS brought hundreds of thousands of individuals into the PIT system. In addition, the top 5% of income earners increased their real incomes as usual, almost independent of GDP growth.
Such developments inevitably mean that the tax to GDP measure creeps upward. Over time, progressive taxation in fact allows for a larger public sector as a share of the whole economy, if you don’t stop it with tax cuts, that is: “We are building a developmental and not a welfare state,” President Jacob Zuma said in the 2011 State of the Nation Address.
Where did the 25% benchmark come from?
It seems it was inherited as “tax business as usual”. The apartheid government built a welfare state for whites only, taking care of “the poor white problem”. Here is the instructive diagram from the 1996 Budget Review:
 Diagram from the 1996 Budget Review.
As the chaos at public hospitals shows, South Africa needs a welfare state, but for all, including a decent basic income grant with the state as the employer of last resort. But here you can be met by the strangest of arguments.
Cohen writes: “There are countries around the world where the very wealthy get away with outrageous inequity. And there are countries in the world where the rich are not paying their fair share. The problem is that SA is in neither of those categories.”
Is that so?
In an argument against higher taxes, one would have expected to find mention of looting – well over R100-billion in tax losses per year from illicit outflows and economic crimes, R30-billion per year in wasteful and fruitless expenditure or overpriced trading with a captured state to the tune of R240-billion lost in 2016.
Until the struggles against all those evils are won, we have no choice other than paying our taxes, increasing taxes for those who certainly can afford it, and treating private and corporate tax dodging as a part of the looting of the public sector. DM/MC
Dick Forslund is senior economist at the Alternative Information & Development Centre.