


 A total of 58 community members participated in fieldwork across the three cities. The results of the mapping campaigns were detailed city-scale heat maps revealed on 13 June 2024 that can inform urban planning and emergency management decisions for improved resilience to future heatwaves. (Photo: Chris Morgan for the World Bank)
In recent years, climate change has significantly escalated the effects of extreme heat across urban South Africa, increasing pressure on public health, energy infrastructure and economic productivity.
As the region continues to experience an increase in the number of hot days and warm nights, researchers and community volunteers from across Cape Town embarked on a community heat-mapping campaign to identify areas facing greater exposure to extreme heat.
The Heat Watch campaign involved a participatory mapping process to gather tens of thousands of air measurements in a single day across Cape Town. This formed part of a broader effort across South Africa to pinpoint specific locations within cities that are vulnerable to extreme heat exposure in a warming world.
 Lebohang Mponya was part of the community volunteers in Cape Town who collected thousands of heat and humidity measurements. (Photo: Chris Morgan for the World Bank)
The campaign is part of the World Bank’s City Resilience Programme and the National Treasury’s Cities Support Programme. It was conducted by Capa Strategies in partnership with the World Bank Group, the Global Facility for Disaster Reduction and Recovery, the City of Cape Town and the Community Organisation Resource Centre.
Bradley Riley, a disaster risk management specialist for the World Bank, said: “Extreme heat poses challenges for almost all aspects of life in cities, including health, food and water security, the economy, infrastructure, crime and education. Due to global climate change, South African cities will experience more frequent and intense heatwaves in the future.”
Riley said a previous study had found that heat stress differed by at least 5°C on a typical hot day between neighbourhoods, with green and widely spaced residential areas experiencing lower heat stress than dense neighbourhoods built with heat-trapping materials.
“These ‘thermal inequalities’ result in vulnerable citizens bearing the brunt of climate change, including higher risk of heat-related illness and greater impacts on income and livelihoods. Through the citizen-science campaigns, residents gathered data that will be used to generate detailed heat maps.
“The insights from the campaigns will help cities prioritise actions to reduce harmful heat exposure, whether through using trees, shade and urban design to make the physical spaces of the city cooler or initiating extreme heat alerts and emergency management measures during heatwaves,” he said.
Heat Watch provides a snapshot of where heat is most concentrated across cities, improving on coarse satellite-derived descriptions with high-resolution descriptions of heat at the human level. Supporting anecdotes and thermal photographs from Heat Watch volunteers also help to describe personal experiences in locations and generate community-based ideas for solutions to cooling off specific areas.
A citizen-scientist approach was adopted to carry out the fieldwork by the South African branch of Slum Dwellers International (SDI) and its community networks.
Charlton Ziervogel, the managing director of the Community Organisation Resource Centre (Corc), said that over the past few years, the SDI network had become more aware of the impact of climate change on informal settlements and slum dwellers across the globe.
The “vehicle transverse method” was used to collect the data, involving the driving of vehicles on different routes with heat sensors and thermal cameras to visually investigate surface temperatures and record observations of the built environment and human behaviours.
Ziervogel said the data collection areas were initially identified by the city, and once Corc was brought on board, they identified additional areas of interest.
Community mobilisation and stable engagement included working with taxi authorities, the SA Police Service, metro police and general public awareness.
In the study area, eight routes were chosen covering about 200 sq km — including the suburbs of Joe Slovo Park, Khayelitsha, Killarney Gardens, Milnerton, Montague Gardens, Mowbray, Rondebosch, Woodstock and Wynberg.
 From left: Nobuzwe Pikashe, Lebohang Mponya and Angeziwe Njameni in Cape Town with the fitted temperature sensor they attached to their vehicles and drove on pre-planned routes across their cities, collecting thousands of heat and humidity measurements. (Photo: Chris Morgan for the World Bank)
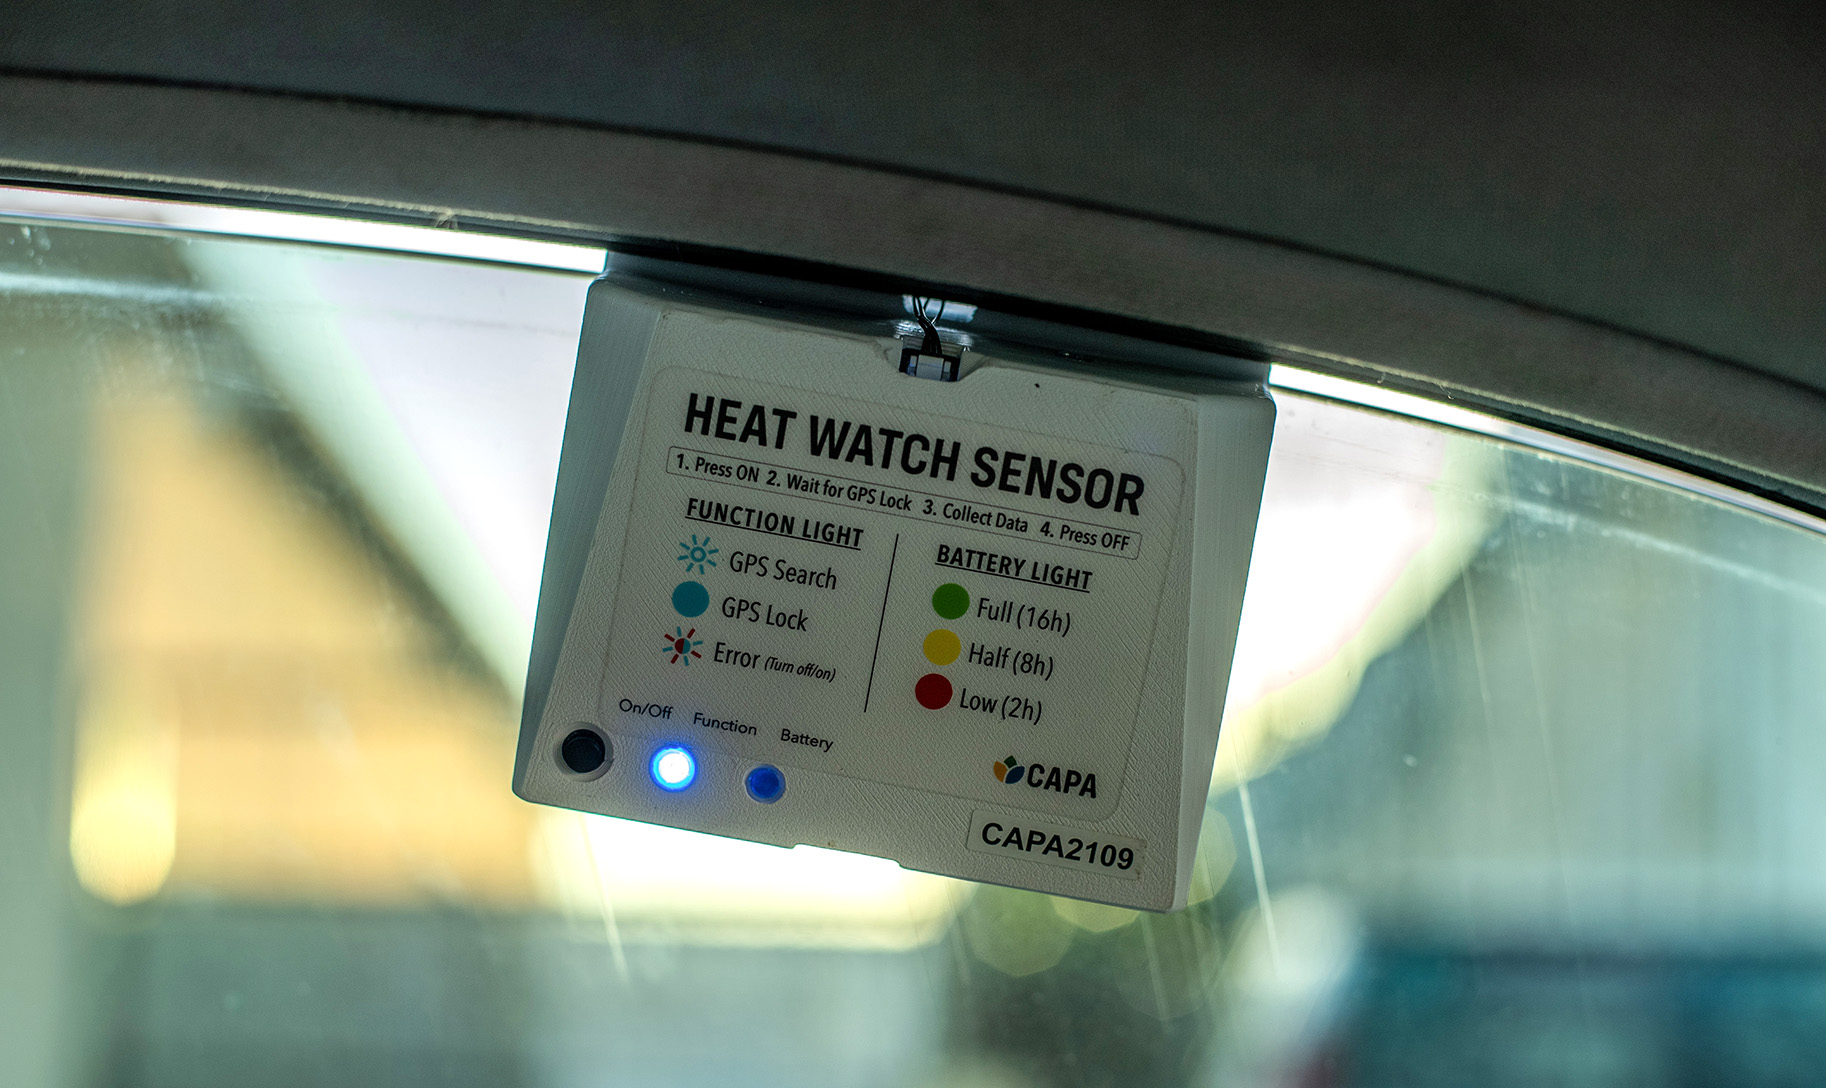
Volunteers used heat sensor infrared cameras on their phones and mounted Heat Watch sensors on the windows of their vehicles, started their navigation software and gathered ambient measurements in residential neighbourhoods, parks, industrial districts, rural areas and the like — measuring heat on the given route for different times of the day.
There was a single day for data collection, representing typical conditions that produce urban heat island effects: high temperatures, low cloud cover, low wind and no precipitation.
The fieldwork date was 28 February 2024, a hot day when community members drove along the routes during three periods: the morning from 6-7.30am, the afternoon from 2-3pm and the evening from 6-7pm.
The outcome was an Excel database of all the data and infrared photos of different route points, which was handed over to Capa Strategies.
 Community volunteers fitted temperature sensors to their vehicles and drove on pre-planned routes across their cities, collecting thousands of heat and humidity measurements. From left: Thamara Hela, Phamela Ketie and Musa Njube in Cape Town. (Photo: Chris Morgan for the World Bank)
Using the information, analysts from Capa generated high-resolution models and datasets that describe the distribution of heat across the city.
Riley said that two of the most serious consequences of increased heat for South Africa were the projected increase in the number of “hot days” (maximum temperature above 35°C) and the projected nighttime temperature increase extending the warm season and increasing heat-health risks.
“With the steadily increasing pace of urbanisation, South African cities will see increasing pressure on public health, energy infrastructure and economic productivity. With one of the highest income inequality rates in the world coupled with a legacy of exclusion and insufficient employment opportunities, concerns about maintaining livelihoods with worsening levels of exposure to climate-induced threats are of imminent concern,” he said.
What the data reveals in Cape Town
The highest temperature recorded on the day was 41.6°C in Woodstock and the lowest was 16.3°C.
As shown with Heat Watch Cape Town, Riley said much of the variation in heat across cities could be attributed to the design of the built environment, with tree canopies and natural spaces tending to cool places off while built-up areas and impervious surfaces retained heat throughout the day and night. The morphology, geography and elevation profile of Cape Town appeared to also affect the temperature distribution.
According to the heat map, areas such as Woodstock with dense development seem to create a pocket of higher temperatures near a residential area. Built-up urban areas like Elsies River with industrial land use appear to concentrate heat throughout the day and night. In dense urban areas like Tafelsig, the presence of trees and bodies of water can alleviate heat.
 Thamara Hela of the Informal Settlement Network (ISN) in Khayelitsha. Hela was among the community volunteers in Cape Town who collected thousands of heat and humidity measurements. (Photo: Chris Morgan for the World Bank)
Riley said, “From a glance at the data collected, there’s a huge regional weather effect in Cape Town. In the actual maps, we see the northern parts of Cape Town are a lot hotter than the southern parts, and that’s due to the wind direction and the geographical location of the city. It’s quite a complicated city and the geography of the city also affects the heat dynamics throughout Cape Town.
“This is at a city level, but when you go into a neighbourhood level, what we are seeing is dense population, dense buildings, specific urban areas, industrial areas and informal settlements where there are densely urban, compacted zones are increasing temperatures quite exponentially, and it’s quite significant compared to the more dispersed areas, the more green and leafy areas.”
A key takeaway was that neighbourhoods with densely packed buildings and no trees had temperatures of as much as 15°C higher than cooler neighbourhoods, while vegetation, shade and building materials can reduce surface temperature by more than 10°C.
Riley said, “Some of these areas [with high temperatures] are the Milnerton corridor, which is quite an industrial area with dense, compact buildings, and the urban footprints are not green at all,
“The vehicle that I went through [on 28 February] was actually in that area, and it was strikingly hot. When you look around, there’s virtually no tree cover, no vegetation providing that cooling effect, and you can feel it on the ground.”
Riley said the southern region, in the Khayelitsha area, was a lot cooler than the northern region, even though they were both by the coastline.
“What we’re seeing is the wind direction from the southern area is going inland so it’s bringing that breeze from the ocean and cooling the inland areas. Whereas in the northern side, more in the Milnerton area, the wind directions in the opposite way — the wind is going more into the sea, into the ocean and not inland.”
 The average model combines the three time periods (morning, afternoon, and night) with equal weight, providing a picture of daytime exposure. Compared with the concentration of heat in central Cape Town, traverses collected in the southern portion of the Cape Town study area appear much cooler. (Image: StoryMap by CAPA Strategies)
Community volunteers
Thamara Hela, from the Informal Settlement Network (ISN) in the Western Cape and a community leader in Khayelitsha, told Daily Maverick: “I’m worried about [heat risks]… I’m living in an informal settlement so for both summer and winter we need to be prepared.”
Hela hoped there would be more workshops to educate people about the risks they face in a warming world, “especially in our communities because people don’t understand. Even on my side, it was difficult.
“My route was in Athlone… We didn’t get too many challenges on the ground because before you start the project you need to know which routes are for Congress for Democratic Taxi Associations (Codeta) and which routes are for Cape Amalgamated Taxi Association (Cata) [rival taxi associations], and also inform the taxis that this happening.
“If we didn’t explain before, we will get challenges, especially in Khayelitsha, Philippi and that side,” Hela said.
Nolwando Mayongo, from the Federation of the Urban Poor, lives in Delft and was also part of the fieldwork team that collected heat data in Cape Town.
“I experienced the heat on that day and knowing that the climate will change, I’m so worried… Summer is [already] killing me, imagine it’s going to be hotter than before,” Mayongo said.
Heat mapping in Buffalo City and City of Tshwane
 The heat mapping campaigns were implemented by citizens in the three cities. Community volunteers were mobilised for the ‘citizen science’ heat measurement campaigns with two days of fieldwork undertaken in each location. (Photo: Chris Morgan for the World Bank)
Riley said, “These heat mapping campaigns were done in Buffalo City, the City of Tshwane, and the City of Cape Town. These are the three cities that asked us for support and technical guidance that they needed. All three cities are in different phases in their journey. Cape Town is far ahead of the other two, whereas Buffalo City is really at the beginning phases and Tshwane is a little bit further along.”
The World Bank is now helping the City of Cape Town with heat-health early warning systems and heat messaging.
“That’s something that they are struggling to fill that gap with at the moment. They’ve got a great heat action plan that’s been implemented this past year, but it’s still missing that heat-health early warning system aspect and messaging with how to target vulnerable populations, how to warn them and get that message across,” Riley said.
“It’s so important that the most vulnerable are warned, and know what to do and how to respond to in the future.”
 A total of 58 community members participated in fieldwork across the three cities. The results of the mapping campaigns were detailed city-scale heat maps revealed on 13 June 2024 that can inform urban planning and emergency management decisions for improved resilience to future heatwaves. (Photo: Chris Morgan for the World Bank)
Crucial to achieving this is getting participation, interest and buy-in from the communities at risk and Riley said this was why they opted to take a citizen-science approach.
“The most vulnerable are in the face of climate change impacts, and they need to be part of the solutions from the start to the end.”
Cape Town’s vulnerability to high heat days and heatwaves
City of Cape Town deputy mayor Eddie Andrews said that climate change projections for Cape Town indicated that average temperatures, high heat days and heatwaves were set to increase in length, frequency and intensity.
The heat mapping campaign showed that locations most at risk from excessive heat are dense urban and residential areas, industrial areas, informal settlements and densification areas around transport corridors. The lack of greening in some areas also had a profound impact.
“Cape Town’s workforce is at particular risk, specifically those working outdoors whose exposure to heat for long periods can have devastating health impacts and impact their ability to complete tasks and concentrate,” Andrews said.
To address this risk, the city’s High Heat Day and Heat Wave Action Plan were approved in November 2023.
The idea was to use the outcome of the heat mapping campaign to prioritise heat mitigation actions that target the most vulnerable populations. DM