


Professor David Everatt’s analysis (Dramatic decline in electoral support of ANC clear from new national poll, Daily Maverick, 4 February 2024) of data from the large polling survey commissioned by Roger Jardine’s Change Starts Now party, brings to mind the physicist Wolfgang Pauli’s remark: “That’s not right. That’s not even wrong.”
Prof Everatt erroneously includes interviewees’ non-responses among his projections of party support. This falsely reduces all parties’ scores.
After correction, his provincial data actually indicate an ANC majority in all six most-rural provinces, not just Limpopo and Eastern Cape. Extrapolating, the ANC gets 47% nationally, with the DA 22% and EFF 19%. These figures compare closely with Ipsos’s latest projections for medium to low turnout.
And with some arithmetical modelling (since this author has not had access to the full data set), the ANC emerges nationally at 47%, not 42% (though Everatt narrows his focus to registered voters intending to vote). This would be close enough to the 50% mark for the ANC to dispense with bigger parties such as the EFF or DA as coalition partners.
These differences are not trivial – they have far-reaching implications for commentators and party strategists. So where exactly does the error lie? It is simply that Everatt repeatedly discusses provincial percentage distributions of party support drawn straight from the survey, which of course include a category for non-responses by interviewees (“don’t know”, “won’t vote” etc).
But on voting day, only substantive opinions count, crosses marked on the ballot paper. Keeping non-responses in contention is like creating a ghost party, with the consequence that the numbers achieved by all other, real parties in the survey are erroneously lowered. In order to present an accurate picture of the survey’s projected electoral outcomes, one has to remove and adjust for the non-responses, one way or another.
Let’s look at a couple of examples. Consider the Western Cape bar in Everatt’s provincial chart, based on the survey. Note that it includes 18% of non-responses – 11% “don’t know/refused” and 7% “won’t vote/none”. He interprets the bar as follows: “The ANC in the Western Cape has continued to decline, from 29% in 2019 to 24%.”
Ghost party
Here is the mistake: he is comparing an historical result from the 2019 election, 29%, with a figure from the 2024 survey, 24% … in a tally that includes the 18% non-responses. Retaining this 18% in contention effectively creates an additional “ghost party”, because of which all the other party figures are erroneously low.
Similarly, he writes of the DA in the Western Cape that in 2019, it “won a respectable 56% … The current 42% is a quite remarkable drop”. Again, the drop is partly because of the presence in the tally of the 18% non-responses, the ghost party.
Clearly, if we are to compare the survey projections for the 2024 election with actual results from previous elections, the survey figures for non-responses have to be removed and adjusted for. Otherwise, as is the case throughout Everatt’s discussion, all the survey-based projections for the respective parties are misleadingly low.
The simplest correction is to recalculate party preferences as a percentage of the total of those who did indicate a choice. That is equivalent to what actually happens on polling day.
Let’s do the arithmetic. For the Western Cape, the bar in the graph shows that 11+7=18% didn’t express a choice. In other words, 100–18=82% did express a choice. To reflect what the survey is actually telling us, the recalculation must therefore express the party preferences as a percentage of 82.
Looked at in this way, Western Cape DA gets 42 out of 82, or 51% rather than Everatt’s 42%: still a majority, and a rather less “remarkable drop” from 2019’s actual vote of 56%.
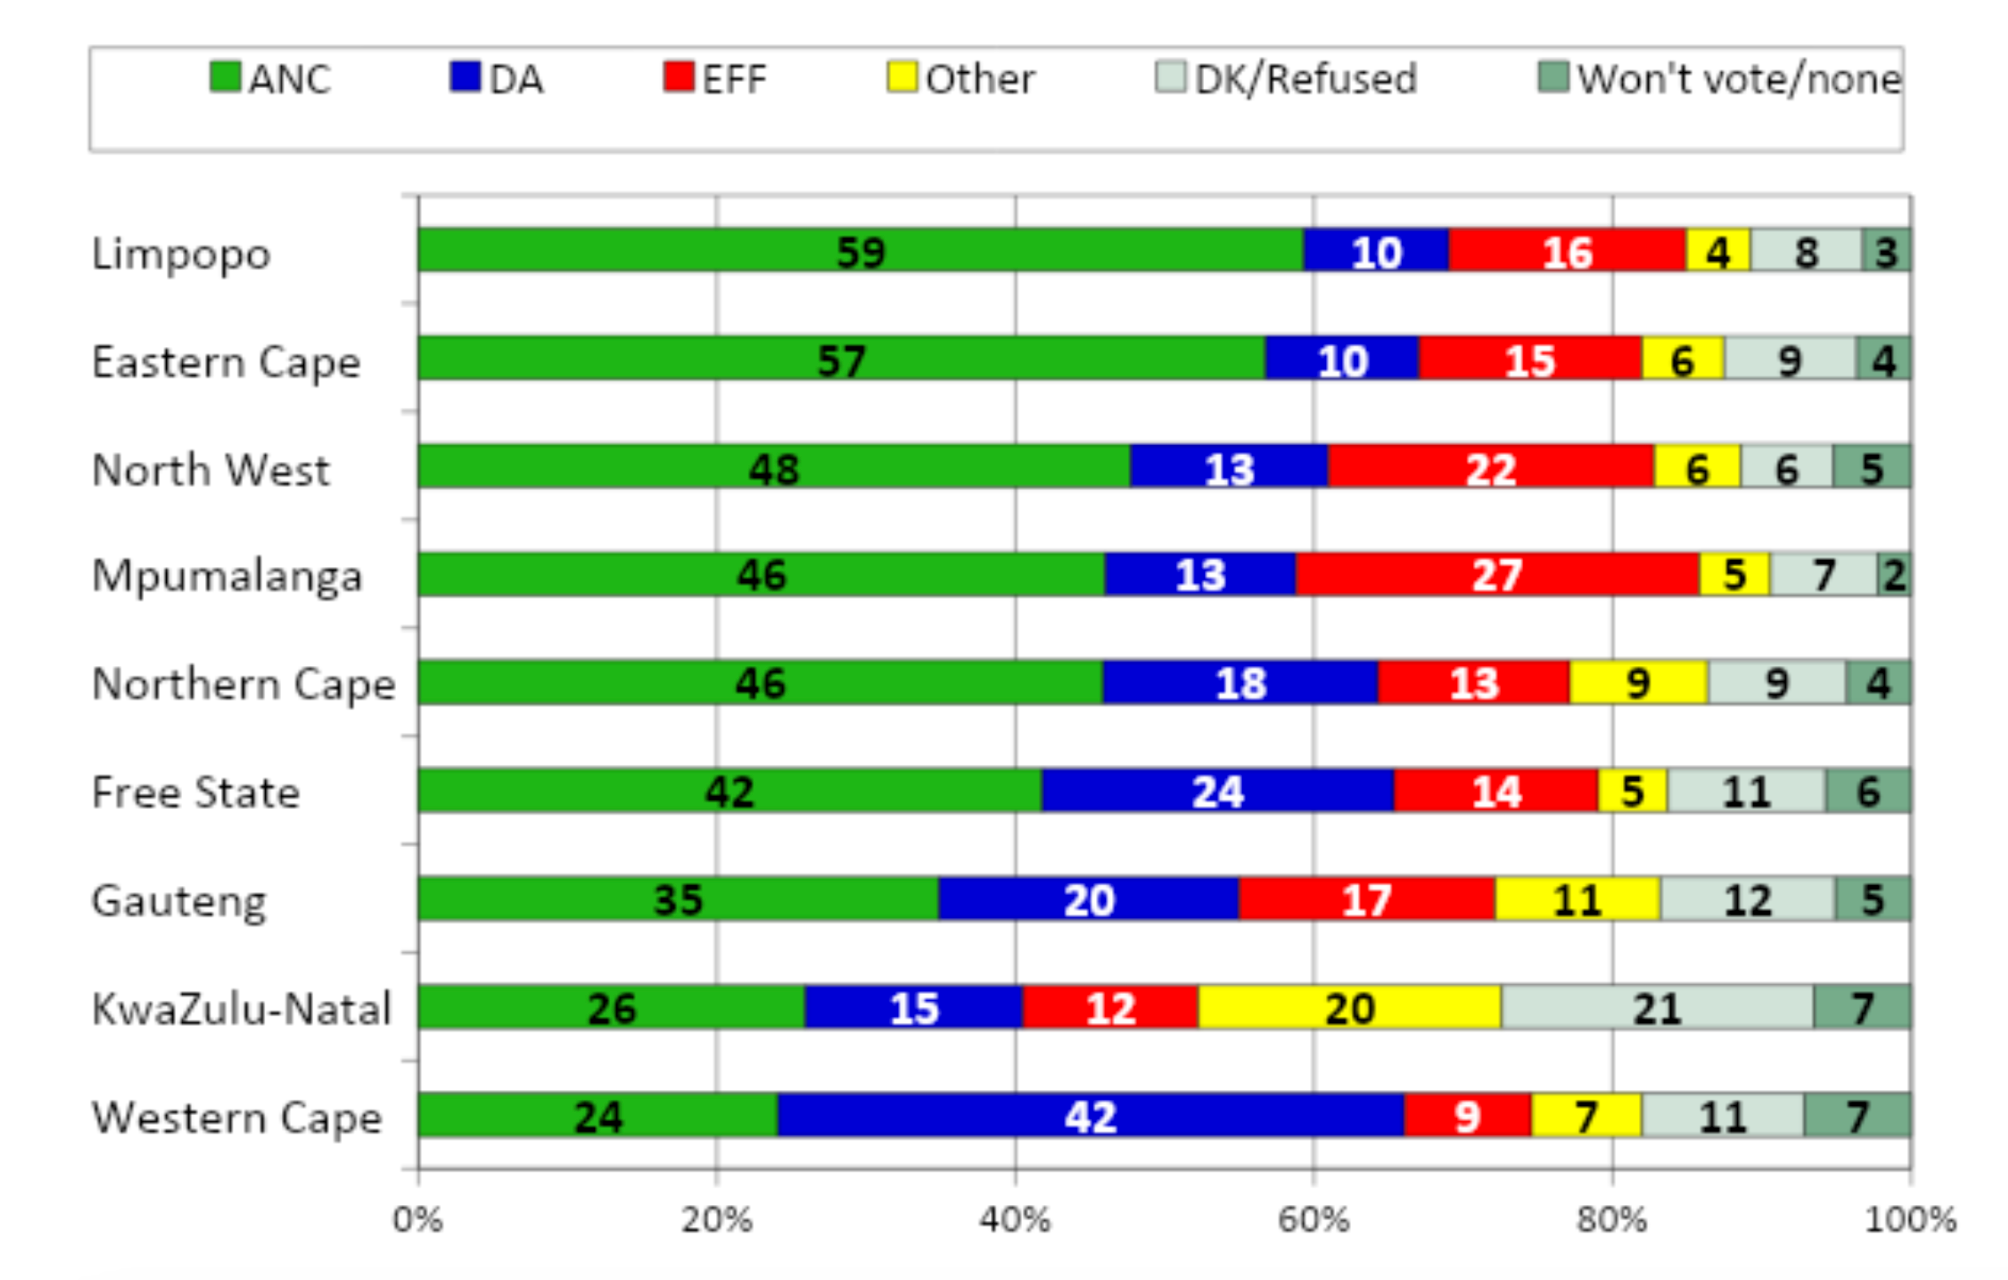 David Everatt’s graph of the provincial breakdown of voters.
Take Mpumalanga as another example. The non-responses, the score of the ghost party, are 7+2=9% So we must express party preferences as a percentage of 100–9=91, not 100. Taking the ANC’s 46% in the chart as an example, 46 out of 91 gives 51%.
The simple adjustment has turned the ANC’s narrow minority into a narrow majority, showing the province as retained in the governing party’s camp rather than, as the mistaken analysis would have it, a loss.
My table below shows the adjusted outcomes for all the provinces, after excluding the non-responses. (Totals different from 100% are from rounding to whole numbers.) It turns out that the ANC retains a majority in six provinces, not only Limpopo and Eastern Cape as suggested by the bar chart.
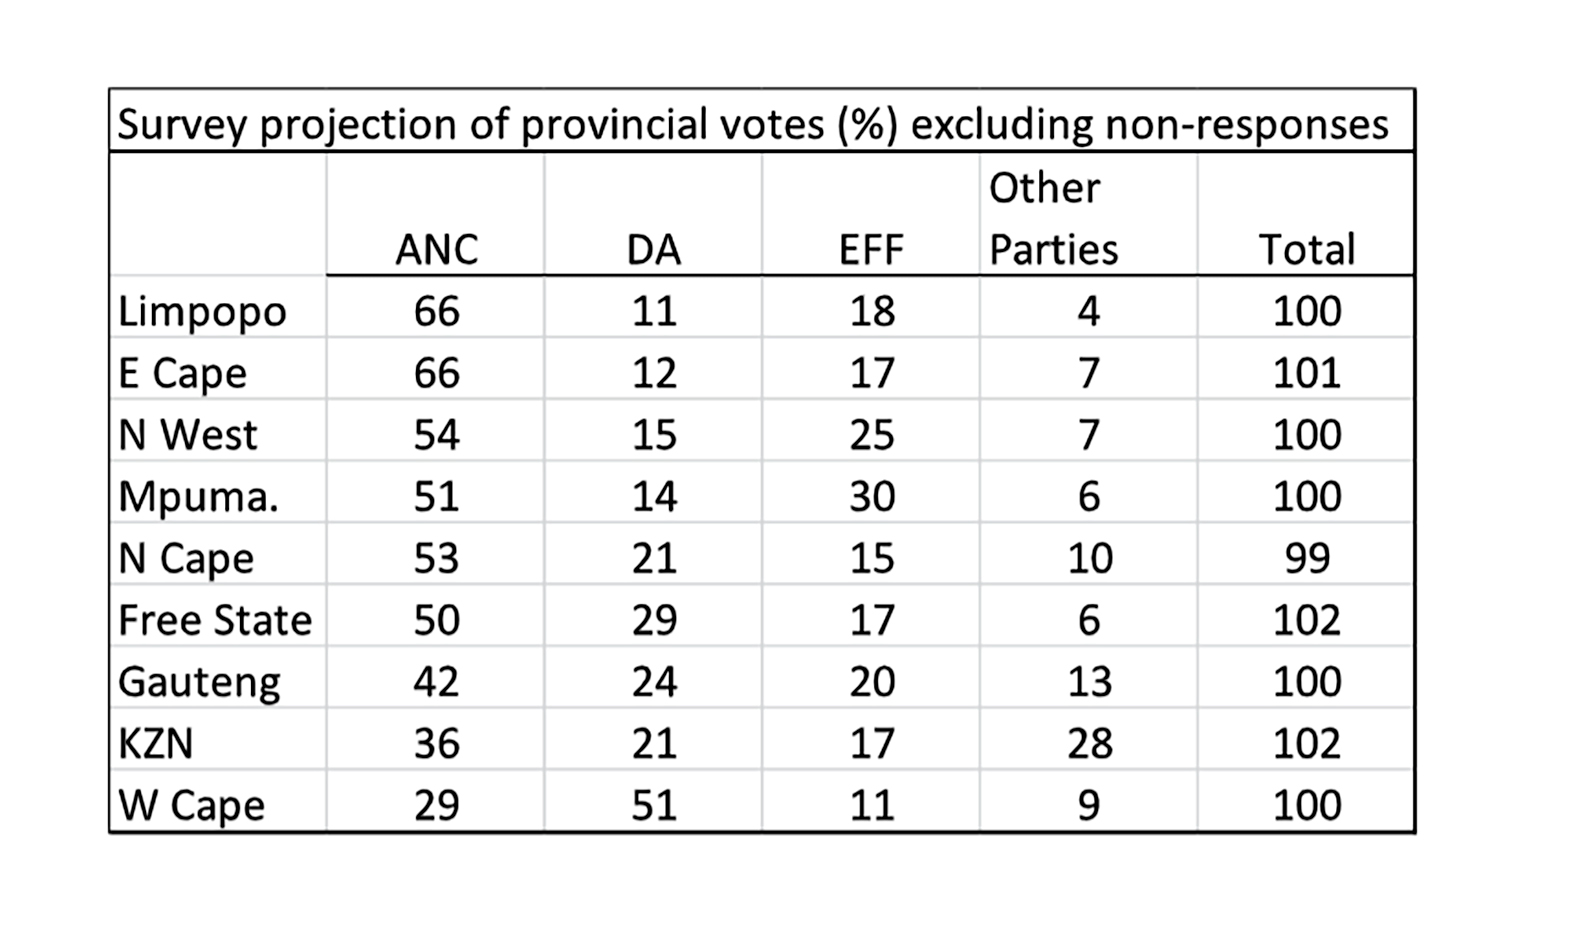 Mark Orkin’s provincial breakdown of provincial votes, excluding non-responses. (Graphic: Supplied)
In Gauteng, excluding the non-responses indicates an ANC vote of 42% rather than 35% in the bar chart, making any coalition that excludes the governing party less feasible. In the Western Cape, the DA retains a majority at 51%, rather than the 42% in the bar chart, equipping it to continue governing on its own.
For KwaZulu-Natal, Everatt mentions that the IFP has been included within “Other parties”. At 15% it equals the DA. After adjustment they are actually at 21% each. And the adjusted ANC vote of 36%, up from the erroneous analysis’s 26%, puts it in reach of power in a coalition with the IFP or either of the other two parties, rather than requiring the messy three-party coalition that the bar chart erroneously suggests.
These are important differences. Now one should note that the simple re-percentaging I have used to remove non-responses is arithmetically equivalent to assigning the total non-response to parties in the same proportions as the explicit responses. This is very approximate. But it is much less misleading than retaining the non-responses in contention as a ghost party, and erroneously reporting too-low survey projections for all the real parties.
Everatt’s approach to this problem is to surmise that, if survey non-responders do vote on the day, “they largely vote for parties other than the ANC”. This is perhaps plausible in provinces where ANC support is overwhelming, and thus somewhat intimidating for intending supporters of other parties. But by the same argument, in the three provinces where the ANC is in a minority, especially the Western Cape, ANC supporters might be shy to declare for the party in a survey but vote ANC on the day.
What is required is calculation, not speculation. Pollsters “impute” how each non-responder might vote by making simultaneous multivariable comparisons of their profile − by age, sex, race, education, urban/rural − with those who did give a preference (for example, market research house Ipsos has done this in its three polls, the very latest reported here).
So what does the CSN survey project for national results? Focusing more narrowly on those expecting to vote among registered voters, Everatt reports the ANC down at 42%, the DA at 19% and the EFF at 15%, with the rest divided among smaller parties ... and presumably, as ever, the ghost party. But he doesn’t mention the non-responses, so I couldn’t do the simple adjustment.
Instead, I weighted my adjusted provincial table above with the latest IEC registration numbers (reduced by the survey’s “won’t vote” percentages from the graph). Obviously this is assuming that people vote in the national ballot as they did in the provincial.
On this basis, I calculated ANC with 47% nationally, DA 21% and EFF 18%, with the balance across the smaller parties. This turns out to be reassuringly close, within sampling margins of error, to the Ipsos medium scenario of approximately 56% turnout: it yields ANC 45%, DA 21% and EFF 18%.
Although the differences of my figures from Everatt’s may seem modest, the implications for debate and strategy on coalitions are extensive. To recap: at 47% nationally, a coalition by the ANC with just one or two small parties would be sufficient to get it across the line.
Provincially, having a simple ANC majority in six provinces rather than just two could be decidedly more effective, say, for implementation of national policies.
In KZN and Gauteng alike, a coalition by the ANC with any one of the IFP, DA or EFF would be sufficient, and probably less unstable than juggling with several smaller parties. And in the Western Cape the DA would continue not needing a coalition at all.
A concluding homily. It requires access to the full data sets to impute the non-responses and provide turn-out scenarios, as Ipsos does. Given the expense of their enormous 9,000+ respondent sample, Change Starts Now would do well to demand these.
But even without them, the simple adjustment used in this article may at least discourage any future sensationalist reporting of the misleadingly low party-vote projections that result from erroneously retaining non-responses, the “ghost party”, in contention. DM.